Category: Environment

House Passes ESA Reform as Veto Looms

Last week, the United States House of Representatives vote on the Endangered Species Act (ESA) passed 219 to 190.  HR 4315 will now go to the Senate and the White House has said that it will veto the bill.

In addition to requiring federal agencies to make ESA decisions publicly available while respecting while respecting state data privacy laws and private property, HR 4315 would:

  • Require the federal government to disclose to affected states data used prior to an ESA listing decision, and require the federal government’s “best available scientific and commercial data” to incorporate data provided by states, tribes, and local county governments.
  • Require the U.S. Fish and Wildlife Service to track, report to Congress, and make available online the federal taxpayer funds used to respond to ESA lawsuits, the number of employees dedicated to ESA litigation, and attorneys’ fees awarded in the course of ESA litigation and settlement agreements.
  • Prioritize species protection and protect taxpayer dollars by placing reasonable caps on attorneys’ fees to make the ESA consistent with existing federal law. For example, the federal government limits the prevailing attorneys’ fees to $125/hr in most circumstances, including federal suits involving veterans, Social Security, and disability, supporters said. But under the ESA, attorneys are being awarded huge sums, in many cases, at a rate much as $600/hr, they indicated.

Sniffing Out Bad Environmental Policies Is Much Like Culling Rotten Produce

When buying produce, we’ve found ways to discern which pieces are worthy to place in our basket. Each piece of fruit or stalk of vegetable must be of good quality to justify spending our hard-earned income on it. So we look, we sniff and we gently squeeze them in order to cull the unripe or rotten pieces and glean the good ones.

Perhaps we should use a similar approach when evaluating the competing environmental proposals proffered by various organizations. We should carefully sniff out the rotten assumptions and gently squeeze the reasoning of their justifications in order to glean which proposals might be worthy of our real sacrifice in national treasure and personal freedoms.

For example, consider the World Bank’s proposals for reducing man-made influences over global climate change. Like most other organizations, they stress the urgency for all nations to take immediate, coordinated actions to reduce carbon emissions. However, they stress that the needed sacrifices should not be shared equally among the nations.

Upon closer inspection, the World Bank’s policy recommendations reveal intellectually unripe assumptions that employ ethically rotten reasoning to justify them. For example, in the World Development Report 2010, the President of the World Bank stresses that,

Developed countries have produced most of the emissions of the past and have higher per-capita emissions. These countries should lead the way by significantly reducing their carbon footprints and stimulating research into green alternatives.

First, consider the intellectually unripe assumption that per-capita carbon emissions are an appropriate basis for determining relative global warming culpability across the nations, and to identify which nations should bear the brunt of costly remediation efforts.

Let’s remember that carbon emissions result from economic activity. All else equal, greater economic activity in a nation’s economy creates greater carbon emissions per capita, but also greater prosperity (output per capita) for its citizens enjoy.

Humanitarians should want the citizens of all nations to become prosperous, but to achieve their prosperity with the smallest environmental footprint possible. Therefore, would not an intellectually ripe indicator of culpability be carbon emissions per-dollar of economic output?

Using this perspective, we could identify the various institutional characteristics among the nations that tend to create a “greener” prosperity, which would then better inform the efforts of environmental policy makers. For example, I point out in an earlier blog post that countries pursuing prosperity through free markets rather than through centralized planning consistently produce fewer greenhouse gas emissions, per dollar of GDP.

Second, consider the ethically rotten policy implications that this intellectually unripe measure would likely create: In order for a nation with heavy carbon emissions per capita to reduce its culpability in global warming crimes against humanity, it must make relatively greater sacrifices. It must decrease its economic activity using current technologies and divert significant portions of its national treasure towards developing “green” technologies. Nations with lower per-capita emissions would not be called upon to sacrifice as much.

This means a country like China, which has an economy similar in size to the U.S. but generates 43% more total carbon emissions, would be expected to sacrifice less than the U.S. Why? With its 2 billion citizens (6 times the 325 million U.S. citizens), Chinese carbon emissions per capita are still far lower than the U.S.

This ethically rotten perspective ignores the fact that China has produced far more carbon emissions per dollar GDP than the U.S. As a result, Chinese citizens bear a much lower level of prosperity (output per person) than U.S. citizens, despite having imposed a far larger total environmental footprint than the U.S.

Using per-capita carbon emissions as an indicator of climate change culpability?  Hmm… I think I smell something rotten in Denmark.

A Reevaluation: Does Environmentalism Necessarily Mean Radicalism?

What does the average citizen think of when they hear the term environmentalist?

Answer: a tree-hugging, bulldozer-sabotaging, disobedient hippie, who hates modernization and technological innovation. However, while these connotations may apply to some (very few) environmentalists, I assure you that this is a completely skewed and absurd definition.

Nevertheless, environmentalists have understandably earned this bad reputation over years as a result of their ever-increasing radical approaches. In cahoots with the Environmental Protection Agency (EPA), they have repeatedly blocked legislation that would have created jobs and improved the economy. Although I consider myself environmentally-friendly, I shy away from terming myself an “environmentalist” due to all of the negative connotations that come along with the label.

However, a point of clarification needs to be made with regards to the term. Here is Britannica Encyclopedia’s definition ofenvironmentalism:

Environmentalism is a political and ethical movement that seeks to improve and protect the quality of the natural environment through changes to environmentally harmful human activities; through the adoption of forms of political, economic, and social organization that are thought to be necessary for, or at least conducive to, the benign treatment of the environment by humans; and through a reassessment of humanity’s relationship with nature. In various ways, environmentalism claims that living things other than humans, and the natural environment as a whole, are deserving of consideration in reasoning about the morality of political, economic, and social policies.

Often times, environmentalists tend to focus on one issue at a time, such as climate change or conservation or pollution. As a result of this myopic perspective and a manipulation of the above definition, environmentalists solely intend to limit human interaction with the environment. Thus, they have earned their title as unreasonable and radical. However, if environmentalists want to actually take effective action, they need to reevaluate their objectives and start working with human interaction in the environment, “[reassessing] humanity’s relationship with nature.” Additionally, they need to have an agenda broader than simply one target issue.

Thus, if environmentalists choose to operate within the bright green framework, which encourages technological innovation and economic growth, they will be more effective in their wider range of feats. Furthermore, by aligning themselves more closely to the definition of environmentalism and avoiding radical, perverted interpretations, they will also garner a more favorable reputation.

Tanner Davis is a research associate at the National Center for Policy Analysis.

Brazil’s Environmental Policy: A Model for the United States?

In a 2009 study conducted by the Public Library of Science on the evaluation of the relative environmental impact of countries, Brazil ranked 1st on a scale measuring absolute composite environmental rank. The study’s methodology used a lower rank to correlate with a higher negative impact. Thus, Brazil had the highest overall negative impact on its environment of any country. According to this study:

  • National Forest Lost Rank: 1st
  • Natural Habitat Conversion Rank: 3rd
  • Marine Captures Rank: 30th
  • Fertilizer Use Rank: 3rd
  • Water Pollution Rank: 8th
  • Threatened Species Rank: 4th
  • Carbon Emissions Rank: 4th
  • Absolute Composite Environmental Rank = 4.5 (1st)

While these numbers appear bleak for the country that just hosted the World Cup and the Olympics in two years, Brazil, according to the Economist, has become the world leader in reducing environmental degradation in recent years.

In the 1990s, Brazil felled rainforest the size of Belgium annually. However, in the past decade, Brazil has reduced deforestation by nearly 70 percent in the Amazonian jungle. If deforestation had continued at its 2005 rate of 19,500 km2 per year, an extra 3.2 billion tons of carbon dioxide would have been emitted. Thus, Brazil could also be viewed as a pioneer for climate change mitigation. Unlike other countries, such as Indonesia and the Democratic Republic of the Congo, Brazil has been able to slow and stop these clearances. The reason for its success has been a result of incremental efforts in three stages.

  • Stage 1 (mid-1990s – 2004): The Brazilian government implemented its first bans and restrictions, one of which stated that on every farm in the Amazon, 80 percent of the land had to be set aside as a forest reserve. However, this was the worst period of deforestation because the share was so high that farmers could not comply with the code.
  • Stage 2 (2004 – 2009): The government, making deforestation a priority under president Luis Inácio Lula da Silva, banned farming in nearly half of the Amazon rainforest, as opposed to the original ban on only one-sixth of the area. Additionally, buyers of Brazil’s soybeans declared they would not purchase crops on land cleared after July 2006, discouraging deforestation.
  • Stage 3 (2009 – present): The government banned farmers in the 36 counties with the worst deforestation rates from getting cheap credit until rates fell. Furthermore, a proper land registry, which required that farmers report their properties’ boundaries, was created.

deforestation

Clearly, as the graph above reveals, Brazil has had great success over the last decade at protecting its forests and preventing deforestation. More amazing, even with these regulations to improve environmental degradation, Brazil has had a dramatic increase in food output. Thus, Brazil is proof that a country can achieve environmental and economic gains simultaneously. Although these government regulations would not likely succeed in the United States, perhaps Brazil serves as a model for the U.S. for its priority on environmental protection.

Although forest composes less percent area of the U.S. than it does in Brazil, protecting the infrastructure, creating more efficient energy resources, and improving resource management in the U.S. would serve useful for the economy and the environment. Additionally, as Brazil is proof, improving the environment does not necessarily mean hindering the economy. While regulating carbon emissions in the U.S. will likely cause more economic turmoil, using the bright green framework as the basis for future environmental policy may have success from both the economic and environment perspectives.

Tanner Davis is a research associate at the National Center for Policy Analysis.

Green Growth: Developed vs. Developing Nations

Difference between Developed and Developing

Before getting into the policy portion of this post, a distinction needs to be made between developing and developed nations. While they clearly have different connotations, the definitions are quite fluid and often prompt controversy.

Nevertheless, Princeton University defines a “developed” nation as one that has a high level of development according to certain criteria. Often, economic criteria have dominated the discussion, but recently the Human Development Index (HDI), which combines an economic measure with other measures, such as life expectancy and education, has become a more common use. Those with a very high HDI are considered “developed.”

Contrarily, a “developing” country is one in which the nation has a low level of material well-being or lower levels of HDI.

As no universal definition of either “developed” or “developing” is accepted, the interpretation varies per study. However, for the purposes of this post, the two definitions above, along with accepted identities of nations, will be used to clarify the boundary.

Green growth and Developing countries

According to the Organization for Economic Cooperation and Development (OECD), green growth, a combination of economic policy and sustainable development, attempts to reduce poverty by bolstering economic growth and to address resource scarcity and climate change by improving environmental management. However, while green technology is generally more affordable by developed countries with robust economies, investment is particularly important for developing countries.

  1. The potential impacts, both economic and social, of environmental degradation are unique for developing countries, as they are the most vulnerable to the impacts of climate change and as they tend to be more dependent on the exploitation of natural resources for economic growth than developed nations. Additionally, developing nations face risks from premature deaths due to pollution, poor water quality, and diseases at rates higher than developed nations.
  2. Although developing nations contribute smaller shares of global greenhouse gas emissions than developed nations, they will increase emissions if they follow conventional economic growth patterns.

However, as a report from Duke’s Law School points out, while developing nations have growing demands for climate-friendly processes and technologies, they often face many barriers because of trade policies and intellectual property regulations. Proposed by the study, one solution to the problem would be the establishment of a “global exchange forum in which transnational green technology holders, green venture capitalists, and developing country entrepreneurs could broker for efficient allocation of investment, resources, and technologies.”

Some developing nations have already taken steps to implement green growth policies. Viewed as successful, these regulations and processes are being initiated by other developing nations.

  • Costa Rica: discourages deforestation by paying forest owners through taxes on fuel and water for the environmental services that the forest produces, such as watershed and biodiversity protection.
  • Nepal: recognizes community forest user groups as autonomous bodies for managing and using community forests, generating employment and income from forest protection, tree felling, log extraction, and non-timber forest products and restoring forest resources.
  • Bangladesh: WasteConcern, an enterprise founded in Bangladesh, turns roadside organic waste into agricultural compost, saving millions in foreign currency by avoiding the import of chemical fertilizer. Annually, 124,400 tons of waste is processed, and 986 direct jobs are created.

By helping developing nations gain access to green growth and technology, a core objective of the “bright green” framework mentioned in Profiling Environmentalism, they will be able to simultaneously grow their economies and tackle environmental degradation. Economic growth and environmental sustainability are considered the twin objectives of the bright green framework, objectives that should be embraced by every nation, particularly those with a “developing” status.

Tanner Davis is a research associate at the National Center for Policy Analysis.

Compact Mixed Use Developments Do Not Help the Environment

Compact mixed-use developments are the latest development fad. While such developments promise environmental benefits, the reality is often far different. Two of the largest mixed-use developments in the United States have had limited environmental benefits.

Proponents often cite the fact that mixed-use development residents drive less as an environmental benefit. However, since most car emissions (90-95%) come from cold starts and occur in the first 15 minutes of a trip, the number of miles driven is much less important then the act of driving itself. Reducing the distance driven has a very minimal effect on pollution.

One major redevelopment project is Atlantic Station in Atlanta, GA. Atlantic Station is a new mixed-use development built on an abandoned, polluted steel mill. Cleaning up the steel mill itself, which was a superfund site, clearly had major benefits. But the day-to-day benefits of the mixed-use project are less clear. Despite being located just north of the transit-friendly Midtown area of Atlanta the project was not designed to be transit accessible. All residences come with underground parking and most residents commute to work by car. A bus connecting the development with the MARTA heavy-rail system was discontinued because of lack of use.

Most of the residents of the project moved from other mostly suburban areas of Atlanta but since much of Atlanta’s employment is north of the development, residents may not be driving any less than when they lived in the suburbs. The commute to the Perimeter North Area of Atlanta, which has the largest concentration of jobs in the Southeast U.S., is 13 miles from Atlantic Station. Yet it is only 11 miles from the suburb of Alpharetta, 8 miles from Roswell and 5 miles from Brookhaven. Yet many of these suburban residents who moved to Atlantic Station commute to the Perimeter for employment. And since they cannot reach transit, they commute by car. As a result, no more folks are using transit, and some of the Atlantic Station residents are commuting longer distances than when they lived in the suburbs.

The city of Hayward in the San Francisco Bay area has replaced its affordable housing with a new transit-oriented mixed-use development near its Bay Area Rapid Transit (BART) station. The principle of a transit-oriented development is that most commuters will walk to work or use transit which reduces transportation emissions. However, most of the residences are only affordable to those earning six figure salaries, while most of the employment is in the low-wage service sector. As a result, most of the residents and the workers must commute to their jobs. While approximately 30% use transit, the remaining 70% commute by car. This 30% is still a higher share than the 10% who chose transit when they lived in the suburbs. Perhaps 30% of the retail workers at the development commute by transit, a share not much higher than the San Francisco average.

However, the situation is reversed for the low-income residents. Displaced to the suburbs because their homes were demolished or because their taxes increased so much that they could no longer afford to live in their homes, they now rely on transit which is very limited in the suburbs. When they lived in Hayward, 70% of them rode transit and 30% of them drove. Now displaced throughout the suburbs, only about 10% of them can reach their jobs by transit; 80% now drive and 10% lost their jobs because they could not reach them by transit and could not afford to buy a car. As a result the actual number of people using transit at the Hayward site has actually decreased. More folks are driving, producing more emissions.

There may be lifestyle benefits from building mixed-use developments, but a significant reduction in emissions is not one of those benefits.

Profiling Environmentalism (Part 3)

In “Profiling Environmentalism,” Tanner Davis wrote in this blog that we should all support environmentalists that he labeled the Bright Greens: optimistic folks who exhibit a strong faith that technological innovations and entrepreneurship will help create prosperity with an ever cleaner ecological footprint.

In “Profiling Environmentalism 2,” I followed that these “Brights” understand how economic development is necessary for creating ecological innovations in technology. However, any virtuous cycles between economic progress and ecological innovations requires: 1) that demand for environmental quality increases with prosperity, and 2) that institutions in society must reward entrepreneurial activity that makes environmental quality effective and affordable.

I also noted that Bruce Yandle, et. al. reviewed the sizable literature relating a nation’s prosperity to its environmental quality. They state that while such a link has yet to be proven empirically, studies failed to control for how a nation’s political and economic institutions may affect the development of innovations that promote “green” productivity.

Could enviro-entrepreneurship and innovation be either encouraged or discouraged by a nation’s economic institutions? Would protecting private property rights, upholding the rule of law, and maintaining low levels of government intrusion by excessive regulations and taxation influence the pathway that a nation chooses to pursue its prosperity?

Fortunately, measures of these institutions are collected over 150 countries in the world, and then are aggregated into a country-specific metric called the Economic Freedom of the World (EFW) index. The EFW index, created by Jim Gwartney and Bob Lawson, is published annually by the Fraser Institute.

The freest countries in 2014 include Hong Kong, Singapore, New Zealand, and Switzerland. While Canada is #8 and Australia is #10, the U.S. is only #17. The least economically free countries include Venezuela, Myanmar, Republic of Congo and Zimbabwe.

When a nation’s economy works to feed, clothe, shelter and educate its citizens, this economic activity will impact the environment through air and water pollution, greenhouse gas emissions and depletion of its supplies of natural resources. We can track these measures for each country using the World Bank’s “World Development Indicators” dataset. But the question is: what economic institutions promote the “greenest” pursuit of prosperity and leave the smallest ecological footprint possible?

Figure 1 and Figure 2 represent data from all the nations for which EFW index values and the ecological variables were available. These countries are sorted into quartiles according to their EFW index value, from the least free to the freest countries. Clearly, the level of air and water pollution that is emitted per dollar of GDP produced is LOWER in those nations that pursue free enterprise prosperity with greater economic freedoms.

methane

organic

Likewise, Figure 3 shows that economically freer countries emit FEWER greenhouse gasses per dollar of GDP produced. Further, energy consumed by the vast majority of countries is produced by burning non-renewable resources like coal, natural gas and oil. This means those countries with a lower consumption rate per dollar GDP are practicing a more sustainable growth path towards prosperity. Figure 4 shows that the energy consumed to make a dollar of GDP is LOWER in nations with more economic freedom.

CO2 emitted

energy use

The smallest ecological impact per dollar of economic activity does not appear to arise from the planned economies of socialism or communism. Greater environmental quality and sustainable growth paths to prosperity appear to be more prevalent in countries where the invisible hand is free to “guide” individuals to produce and exchange their products and services in a decentralized market system — established and preserved with greater economic freedoms.

Let’s all be “Bright” about creating our future.

Profiling Environmentalism (Part 2)

Tanner Davis wrote an intriguing article in this blog titled, “Profiling Environmentalism.” He proposed that environmentalists generally fall into three categories:

  • Light Greens: mildly optimistic folks who encourage individual consumers to take small (but in the aggregate helpful) actions to raise environmental quality.
  • Dark Greens: quite pessimistic folks who fear the inevitable environmental destruction as industrialization spreads throughout the global economy. To save the planet, these folks spurn technological advances and seek to abandon modern life.
  • Bright Greens: very optimistic folks, as described by Alex Steffen, who exhibit a strong faith in further technological innovations and examples of entrepreneurial zeal to create prosperity with an ever cleaner ecological footprint.

Davis favors these Bright Green folks, as they embrace the pursuit of human well-being through economic development and environmental well-being through smaller ecological footprints. I heartily agree.

In fact, the “Brights” may inherently understand that economic development is necessary for creating ecological innovations in technology. However, whether a virtuous cycle between economic progress and technological innovation will continue enhancing environmental quality depends on at least two important things:

  • The desire for environmental quality increases with prosperity (individual income), and
  • The institutions in society effectively reward entrepreneurial activity that makes environmental quality affordable for those who seek both prosperity and a “greener” world in which to live.

The idea of an Environmental Kuznet’s Curve (EKC), where higher levels of prosperity in a society initially causes environmental quality to decline, but then eventually causes it to increase again after some level of prosperity is achieved, has been bantered about the economics literature for some time. Many economists don’t believe that the inverted U-shape relationship between prosperity and environmental quality exists, as many different empirical studies have simply not been able to create conclusive results.

However, as Bruce Yandle, et. al. points out in a survey of EKC articles, a nation’s institutions can have significant impact on the rate and quality of technological innovations. This can alter the pathway to prosperity that a developing nation chooses to pursue, which may cause either environmental degradation or improvement. Yet no studies appear to effectively control for this possibility.

If true, then this may be why one developing country exhibits terrible environmental impacts while another country preserves environmental quality, despite their pursuing relatively similar growth paths toward economic prosperity. Perhaps if we could control for institutional differences between these countries, we could identify whether an environmental EKC exists, and whether there are “greener” pathways for all countries to achieve prosperity.

Stay tuned, faithful readers, for “Part 3″…

Profiling Environmentalism

Since 97% of climate scientists believe that global warming results from human activity, targeting the human causes of environmental degradation, such as pollution, CO2 emissions, resource depletion, etc. will be very effective at curbing the threats of global warming and climate change. In approaching an issue of the environment, a policymaker must think about the three main schools of thought on the spectrum of environmentalism: light, dark, and bright green. These three types of environmentalism provide the framework under which policy action will occur.

Light Green

Light green environmentalism targets consumer behavior, encouraging individuals to make incremental changes in their daily lives to reduce harm to the environment. Examples include reusing your own bags when shopping for groceries, recycling, turning the faucet off when brushing teeth, buying LED certified electronics, etc. This framework has clearly been the foundation for the sustainability movement; however, the lack of urgency for change has instilled fatigue and indifference.

Dark Green

Of the three perspectives, dark green environmentalism has the most pessimistic view of modern society, believing that industrialization, manufacturing, and development have solely negative consequences for the environment. Unlike light greens, this shade targets the community level, emphasizing the need to become self-sufficient, free from technological advancement. However, in a world where modernization and industrialization seem to be the norm, rejecting this trend appears economically regressive, since urbanization/industrialization encourages economic growth.

Bright Green

This term is the most recent of the three, coined in 2003 by Alex Steffen. Unlike light and dark, bright greens emphasize the use of technology to solve the environmental issues. As Steffen states in a more recent post, this perspective calls for “innovation, design, urban revitalization, and entrepreneurial zeal.” Bright greens believe in using green technology that will not harm the environment but will continue the trend of modernization to serve common interests. Clearly, bright green environmentalism combines the best of both worlds — environmentalism and economic development via modernization.

Which framework best serves the interests of the U.S.?

After examining these three frameworks, the United States should operate with the bright green mindset, as it provides not only ecological but economic benefits. Since bright green environmentalism embraces technological innovation, this framework encourages more development in order to solve the environment problem. As such, this framework achieves common goals in modern U.S. society: reducing environmental degradation and maximizing economic production. Even more, embracing this ideology could bring the U.S. out of its more recent economic slump. While bright green environmentalism serves the most effective purpose in modern society, which one do you think is the most effective? Which perspective do you most align with?

Tanner Davis is a research associate at the National Center for Policy Analysis.

Smart Growth: Destroying Housing Opportunity from California to Australia (and Beyond)

Two recent stories provide further  evidence on the extent to which urban containment policies (also called smart growth, growth management, compact city policy, livability and urban consolidation) raises house prices relative to incomes, thereby reducing housing affordability. Because housing represents the largest element of household budgets (not transportation as a US government website implies), urban containment policy reduces discretionary income — the money households have left over after taxes and paying for necessities. This leads to a lower standard of living and more poverty, and violates the fundamental purposes of urban planning, described by former World Bank principal planner Alain Bertaud as:

“Increasing mobility and affordability are the two main objectives of urban planning. These two objectives are directly related to the overall goal of maximizing the size of a city’s labor market, and therefore, its economic prosperity.”

Two recent stories describe the effects of urban containment policy on the standard of living:

The Economist and Urban Containment “Fat Cats”

“Free Exchange” in The Economist came  down strongly on the side of economics in a review of housing affordability.

According to The Economist, the unusually high cost of housing in San Francisco (and other places) is principally the result of tight land use regulation, which makes it expensive or impossible to build. If “local regulations did not do much to discourage creation of new housing supply, then the market for San Francisco would be pretty competitive.” Add to that Vancouver, Sydney, Melbourne, Toronto, Portland and a host of additional metropolitan areas, where urban containment policy has driven house prices well above the 3.0 median multiple indicated by historic market fundamentals.

The Economist explains the issue in greater detail: “We therefore get highly restrictive building regulations. Tight supply limits mean that the gap between the marginal cost of a unit of San Francisco and the value to the marginal resident of San Francisco (and the market price of the unit) is enormous. That difference is pocketed by the rent-seeking NIMBYs of San Francisco. However altruistic they perceive their mission to be, the result is similar to what you’d get if fat cat industrialists lobbied the government to drive their competition out of business.” (Our emphasis).

Of course urban planning interests have long denied that that rationing land is associated with higher housing prices (read greater poverty and a lower standard of living). Nonetheless urban containment policies not only drive up the price of land, but do so even as they reduce the amount of land used for each new residence, driving prices per square foot of land up as well.

The Economist notes that unless the direction is changed, housing policy will continue to be “an instrument of oligarchy. Who knows. But however one imagines this playing out, we should be clear about what is happening, and what its effects have been.”

Land Prices Skyrocket as Residential Lot Sizes Fall in Australia

The extent to which smart growth policy (urban continament policy or urban consolidation policy) is associated with higher land (and house) prices is illustrated by a recent press release from RP Data in Australia. The analysis examined the vacant building lot prices for the period of 1993 to 2013.

During the period, the median price of a vacant lot rose 168 percent after adjustment for inflation.This is nearly 5 times the increase in the median household incomes of the seven largest capital cities (Sydney, Melbourne, Brisbane, Perth, Adelaide, Canberra and Sydney).

But it gets worse. The median lot size was reduced nearly 30 percent. This should put paid to the myth that urban containment reduces lot prices as it reduces their sizes. The same dynamic has been indicated in the United States.

Australia has been plagued by huge house cost increases relative to incomes in association with urban containment policy. Before the adoption of urban containment policy, it was typical for house prices to average three times or less than that of household income. Now, Sydney has the highest median multiple (median house price divided by median household income) of any major metropolitan area in the New World, with the exceptions of Vancouver and San Francisco. Melbourne, the second largest metropolitan area in Australia, has a median multiple of 8.4, making it fifth most costly in the New World, behind San Jose. All of Australia’s major metropolitan areas are “severely unaffordable,” including slow-growing Adelaide (6.3), as well as most smaller areas.

Getting Priorities Right

Research on these impacts led London School of Economics professor Paul Cheshire to conclude that urban containment policy is irreconcilable with housing affordability. This means that urban containment policy is irreconcilable with a better economic future for households, including those in poverty.

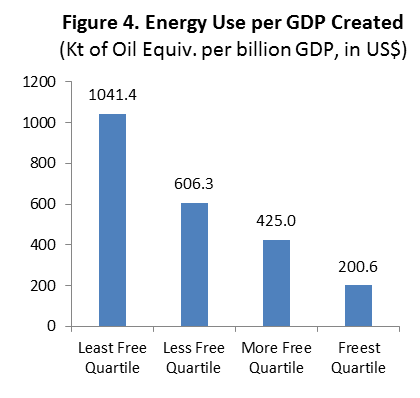
The purposes of urban containment policy are largely driven by a particular vision of the urban form and a manifestly wrongheaded belief that rationing land and limiting mobility can contribute materially to reducing greenhouse gas emissions. The issue is neither urban design nor the expensive and ineffective strategies of urban containment. People are more important — their standard of living and reducing the number living in poverty. There is a compelling need to reorient urban policy in this direction (see Toward More Prosperous Cities).

—–

For a complete listing of median multiples by major metropolitan area, see the 10th Annual Demographia International Housing Affordability Survey.

Additional information on the RP Data research is available at Australian Property Through Foreign Eyes

—–

Note: This article is adapted from contributions by the author to the newgeography.com