Category: Land Issues

The London Green Belt Racket

Paul Miner, Senior planning officer for the Campaign to Protect Rural England took exception to The Economist’s liberal view that it might be time to open up London’s Green Belt to housing development, at least in part to improve housing affordability. We had commended The Economist for allowing a view that average households in the London area deserved decent housing for a price not skewed upward by the planning created land use oligopoly.

Kate Barker, former member of the Monetary Policy Committee of the Bank of England produced two seminal reports documenting the extent to which housing prices are unnecessarily elevated by the planning regime in the United Kingdom. The Demographia International Housing Affordability Survey (which I co-author with Hugh Paveletich of Performance Urban Planning in Christchurch) annually shows housing to be severely unaffordable from Kent to Liverpool (yes, you read right, Liverpool).

I was pleased when my friend Fidelis (not my friend’s real name) penned a letter in response to The Economist, which was not published. This is not surprising, because demand for letter space in The Economist exceeds the supply by nearly as much as the demand for decent housing exceeds the supply of affordable stock in the United Kingdom.

Fidelis also sent me a copy, which is published below:

“The Green Belt Racket”

Dear Economist:

Paul Miner may well argue for the utility value of “Green Belts”. The basic question that needs to be asked about these, is whether greater benefit at much lower cost would be provided by Green enclaves that remain off-limits to development within a region otherwise open to development. The imposition of a Green Belt, including in Mr Miner’s examples of Seoul and Toronto, has always been followed by relentless declines in housing affordability. The same applies to an urban growth boundary.

The crucial factor in housing affordability everywhere, is the freedom to convert rural land to urban. This does not require the abandonment of a “green and pleasant land” to developers; as long as there is a broader “freedom to convert land”, any amount of land may be placed in “preservation” enclaves without inflating urban land rents in the way that a continuous boundary or belt does. And a multitude of “enclaves” are likely to be accessible to a greater number of people, and command lower “premiums” of price for adjacent properties, making proximity to them affordable to a greater proportion of the population.

Paul Cheshire and Edwin S. Mills, in their Introduction to the 1999 “Handbook of Urban Economics, Volume 3”, mention an estimate that the most expensive land (usually CBD land) in the most expensive growth-contained cities is 100,000 times more expensive than equivalent land in typical non-growth-constrained cities. It is not the advocates of “freedom to develop” who have a case to answer regarding whose pocket they are in, it is the advocates of constraint. The profits made by developers of Greenfield land under true conditions of “competitive land supply” (as in many US cities) are modest and honest. The capital gains made by “big property” through urban growth controls are massive and completely unearned.

Paul Miner argues, as many of his type do, that there is “enough brownfields land” available in London and the surrounds, for 400,000 new homes. But what is the asking price for these brownfields sites? Ironically, Shlomo Angel et al find in “Making Room for  Planet Full of Cities” (2010), that the rate of “infill” of “fragmented” land is higher in low-land-cost, unplanned Houston, than in growth-constrained, high-land-cost Portland. Empty buildings, unrenewed old structures, undeveloped brownfields sites, and speculative properties without tenants due to holdout price expectations on the part of the “greater sucker” current owner – all running along with a severe overhang of massive numbers of “excluded” potential buyers and renters – are all features of supply-distorted property markets such as the UK’s and China’s.

Sincerely,

Fidelis


Atlanta’s Transit Tax Rejection: Saying No to a Dead End Agenda

Atlanta area voters said “no” to a proposed $7 billion transportation tax that was promoted as a solution to the metropolitan area’s legendary traffic congestion, despite a campaign in which supporters outspent opponents by more than 500 to one.

The Atlanta Journal Constitution reported that the measure lost 63% to 37%. This 26% margin of loss was nearly three times the margin shown in most recent poll by the Journal-Constitution. Proponents had claimed that the measure was “dead even” three days before the election. Supporters spent up to $8.5 million on the campaign. Opponents raised less than $15,000.

The tax issue failed in all 10 counties. The defeats were modest in Fulton County (the core county, which includes most of the city of Atlanta) and DeKalb County (which contains the rest of Atlanta). Huge “no” vote margins were recorded in the largest suburban counties. In Gwinnett County, the no votes prevailed by a margin of 71% to 29%. In adjacent Cobb County, the margin was 69% to 31%.

On election morning, the Atlanta-Journal Constitution featured opposing commentaries by regional planning agency (Atlanta Regional Commission) Chairman Tad Leithead and me. Chairman Leithead stressed the view that the tax would lead to reduced traffic congestion, job creation and economic development. My column stressed the view that the disproportionate spending on transit (53 percent of the money for one percent of the travel market) would not reduce traffic congestion.

Observation on the Result

 Voters were asked for $7 billion to not reduce traffic congestion. The electorate was wise enough to know that spending more than 50 times as much per transit rider as per car passenger could not reduce traffic congestion in a city where transit moves only one percent of travel. The result was thus a genuine blow for rational public policy. Atlanta needs transportation that builds the economy by minimizing travel times and reducing traffic congestion. That means getting the traffic moving, not politically correct dead-end strategies out of an anti-economic growth (and ideological) playbook.


Government environmental efforts backfire, hurting the environment and human health

There is a great piece of bumper sticker humor: “I’m from the government and I’m here to help.”  Unless one has been living under a rock, this statement is widely recognized as an ironic warning of sorts – if you hear these words, count your money, lock up your kids and pray for your property, business and/or job. A funny way of saying when the government tries to solve a problem, things often go from bad to worse.

It should not surprise anyone to learn that the same is true for government environmental efforts as well.

I, among others, have shown that government plans for energy, species, and land management (including public lands, farms and wetlands) have reaped a host of environmental and economic ills.

Recently, more evidence, both from Europe, and here in the U.S., of the disconnect between government’s good intentions and its flawed results have come to light.   For instance, in the U.S., which has yet to sign on to an international treaty or domestic legislation to strictly limit greenhouse gas emissions, such emission have fallen by 450 million tons as the shale gas revolution has taken hold (despite environmentalists ongoing efforts to shut it down).  Market incentives to increase efficiency are leading the U.S. to use the least expensive resource for energy production – all absent government mandates or intervention – and the environment is benefitting.  By contrast, in Europe, which has pledged to cut emissions, environmentalists have torqued the government into closing down the cleanest form of reliable energy, nuclear power, are preventing them from developing the 2nd greenest reliable energy source, natural gas, with the result that Germany is switching to coal – the fuel environmentalist fear the most.

And China, cashing in on the Western demands for inefficient, expensive so called “green” energy technologies (while developing its own energy resources as fast as it can) is ripping up grasslands and draining water to mine coal and produce associated germanium.  Couldn’t get away with it without central government control or backing.

And closer to home, in the U.S., the federal government punishes ranchers who fight wildfires on public land in an attempt to halt it before it gets out of control.  In addition, the government, in mandating the use of compact fluorescent light bulbs (CFLs), put public health at risk from ultraviolet rays (not emitted, by the way, by good old incandescent bulbs) which could damage skin cells and cause eye damage.  Use the new government required bulbs and get skin cancer – isn’t that special.


The Atlanta Transit Tax: For the 1 Percent


Voters in Atlanta, with some of the worst traffic congestion in the nation, are being asked to approve a new tax that would spend more than 50% on transit, in an urban area where transit carries only 1% of travel (Figure). No one is naive enough to think that the new billions for transit would improve traffic congestion. Worse, the distorted program would contribute to worse congestion by spending on billions on transit, which cannot reduce traffic congestion, instead of on roadways, which is the only way that traffic congestion can be reduced.

The July 31 vote is in 10 counties of the 28 county Atlanta metropolitan area. The measure would raise the sales tax by one cent, for $8 billion in transit and highway projects over 10 years.

In a metropolitan area in which barely one percent of travel is by transit, the tax measure would devote more than one-half of the funding to transit (see Figure).  As we wrote in an Atlanta Journal-Constitution commentary, the focus of any transportation revenue issue should be on reducing travel times, whether by transit or highways. This is how transportation improves an urban economy. The reality is that with nearly all travel by highways and transit’s inherently slower travel times, much of the tax money would be spent on strategies that have virtually no hope of reducing travel times or traffic congestion.

Atlanta’s Traffic Congestion: Promoters of the tax claim that the highway projects will reduce traffic congestion. Atlanta is well known for its serious traffic congestion. There are two reasons for this:

(1) Atlanta has a sparse freeway system, which is limited to little more than a belt route (I-285) and three radial freeways (I-20, I-75 and I-85) that converge into two downtown. Seven years ago, we rated Atlanta as having the least effective freeway system among major US urban areas. Nothing has happened to change that rating, except for the addition of 750,000 people. This tax issue will do virtually nothing to improve roadway travel on the regional level.

(2) Perhaps even worse, Atlanta’s regional arterial (high capacity streets) system is virtually non-existent. For this reason, we proposed (in 2000) development of a one-mile terrain constrained grid of arterials . A local editorial writer found this so hard to deal with it that he misrepresented it as a mile grid of freeways to make it look extreme. Later, the Atlanta Regional Council (ARC), the local metropolitan planning organization, included a somewhat more modest (but useful) arterial grid in is regional plan.

The Transit Tax: Fixing What Should have Already Been Fixed: The transit projects have virtually no potential to reduce work trip travel times and thus no potential to reduce traffic congestion. Approximately one-fifth of the transit funding would be used to rehabilitate and upgrade the MARTA subway system, a need that should have been legitimately funded from the existing MARTA sales tax.

The Transit Tax: Subsidizing Land Speculation: Another nearly 20 percent of the transit funding would be spent on the “Belt-Line” streetcar project in central Atlanta. The Belt-Line is more “city building” (read “real estate speculating”) than it is transportation. It will do nothing to reduce work trip travel times. Further, it is exceedingly costly. The extravagance of this project is illustrated by an annualized capital cost alone (principally construction) high enough to pay the lease on a new mid-sized car for each new regular passenger.

The Transit Tax: Emulating Miami? The history of transit is fraught with cost increases and project cancellation and delay as transit agencies, unable to control their rising costs, can spend money for day-to-day operations that had been planned to build new transit lines. This has happened with a vengeance in Miami, where a 2002 transit tax to expand the rail system has largely been frittered away in higher operating costs. It could happen in Atlanta.

The Road Projects: In a metropolitan area in which personal mobility predominates, roadway improvements, such as expansions, an arterial grid in Atlanta’s case and completion of the GA-DOT HOT (high occupancy toll) system provide the greatest potential for reducing travel times. There is another significant benefit to highway investments. As traffic speeds increase fuel efficiency improves and both air pollution and greenhouse gas emissions are reduced.

With less than 50 percent of the funding going to roads, less than one-half the potential benefit of the $8 billion can be achieved. This ineffective return is felt by low income citizens almost to the same extent as everyone else. While 88 percent of all commuters in Atlanta travel by car, the figure is only slightly less (83 percent) among low income commuters (Figure 4).

What’s Right About Atlanta: For all its problems, Atlanta has much to be proud of. Former World Bank principal planner Alain Bertaud said of Atlanta in a 2002 study:

 While income and population were rising very fast, Atlanta managed to keep a very low cost of living. A worldwide cost of living survey conducted by the Economist Intelligence Unit in 2002 found that Atlanta had the lowest cost of living among major US cities and ranked 63rdamong major cities around the world. This achievement is remarkable in view of the rapid rate of growth of the metropolitan area over the last 20 years. It shows that while demographic and economic growth has certainly contributed to generate pollution and congestion, the various actors responsible for the management of metropolitan Atlanta must have done a lot of things right. High income growth and high demographic growth combined with a low cost of living suggests that labor markets are functioning well and that housing does not encounter important supply bottlenecks. (Note on Atlanta’s Superior Housing Affordabilitiy)

 Atlanta’s leadership should go back to the drawing board. A rational proposal is required to reduce Atlanta’s travel times (which are longer than its major US competitors, such as Dallas-Fort Worth and Houston) and grow the economy. There’s no point in spending more than 50 percent on the 1 percent.

(More at The Atlanta Transportation Tax: Too Much for Too Little.)


——

Note on Atlanta’s Superior Housing Affordability: Atlanta was most affordable major metropolitan area in the US, UK, Canada, Australia, Ireland, New Zealand and Hong Kong in the 8th Annual Demographia International Housing Affordability Survey.


Smart Growth on Steriods: Sick Cities

Smart growth on steroids, or the radical densification policy of California,  was the subject of my recent commentary in The Wall Street Journal — “California Declares War on Suburbia”  (http://online.wsj.com/article/SB10001424052702303302504577323353434618474.html?mod=rss_com_mostcommentart). Regional transportation plans in the San Francisco Bay Area, the Los Angeles area and the San Diego area seek to force the vast majority of new residents in future decades into multi-family housing. Under the state’s greenhouse gas emissions reduction law (Assembly Bill 32) and its companion urban planning law (Senate Bill 375), it will be nearly impossible to build new detached housing. This is despite the fact that 80 percent additions to the housing stock in California’s major metropolitan areas was detached between 2000 and 2010.

It was bad enough when misnamed “smart-growth” policies simply sought to ban building beyond the urban fringe (where the city meets the country). The result was as predictable as the effects of an OPEC oil embargo. When developable land is embargoed, its price goes up. How much it goes up is anyone’s guess, because prices cannot be accurately predicted in a manipulated market. In the case of oil, it can be expected that speculators will enter the market seeking a quick profit. It is no different in residential land (and housing), where the was much more speculative activity in the bubble states of California, Florida, Arizona and Nevada (so designated by New York Federal Reserve Bank reserve), and of course there were substantial house price increases.

The amazing thing about this is that underlying housing demand was low in the worst of the bubble states, California. During the bubble, more than 1,000,000 residents moved to other states (California kept growing because of immigration and the excess of births over deaths). By comparison, in Atlanta, Dallas-Fort Worth and Houston (and for that matter Indianapolis, Columbus and Kansas City), there was net immigration, yet housing prices stayed within historic norms. By the time the peak hit, prices in California metropolitan areas were from double to nearly quadruple historic norms.

Now, however, the urban planners want to limit construction to areas that are close to rapid transit stops, and at densities five or more times consumer preferences. Rather than quarter or fifth of an acre lots, planners intend that nearly all new housing will be at 20, 30 or even 40 to the acre. Naively, they assume that this will encourage people to use transit more. Yet, even their own plans don’t show any such impact. In San Diego, the share of travel on transit would rise from less than 2 percent now to less than 4 percent in 2050, despite spending more than half of the highway and transit money on transit. Thus, spending up to 25 times transit’s share of the market returns only the most modest transit ridership increases.

The higher densities are likely to lead to more intense traffic congestion, consistent with the association between high densities and intense traffic congestion around the world. The irony is that the higher the share of travel on transit, the worse the traffic congestion. This is because transit ridership is high only where there is high density, but the transit use does not reduce demand enough to compensate for the larger density of cars.

Urban areas are justified by economics. People have moved to them to have better lives. Raising the price of housing (unnecessarily) and slowing down commuting (because transit is much slower) could work against urban areas that implement such policies and drive people elsewhere. This is evident, already, in the San Francisco Bay area, Los Angeles and San Diego, where growth has slowed to a trickle — places where the net-outmigration is greater even than that of former migration laggards Pittsburgh and St. Louis.

—–

Also see: California Declares War on Suburbia II: The Cost of Radical Densification

http://www.newgeography.com/content/002781-california-declares-war-suburbia-ii-the-cost-radical-densification

How The Lorax Learned to Love Foresters

Tomorrow, the motion picture version of Dr. Seuss’s book “The Lorax” will hit the big screen and the reviews indicate it sticks to the original 1971 storyline. In “The Lorax,” a businessman, the “Once-ler,” moves into town, cuts down all the trees and destroys the forest, air and water in the process. A furry creature, the Lorax, appears and proclaims, “I speak for the trees” and scolds the Once-ler for being “crazed with greed.”

The story is a product of its times, when people like Paul Ehrlich were claiming that the planet’s time was short and that pollution and resource scarcity would soon overwhelm mankind. Time has not been kind to Ehrlich, demonstrating that his predictions and those of other early-1970s environmentalists, were not based in sound economics or science.

Forty years later, The Lorax also shows its age. Since it was published, a different story has been written in forests across the globe. Rather than being at odds, the Once-ler and the Lorax have found a common interest in making sure forests grow and expand – and many of the world’s forests have benefited. Three things stand out.

  • Last year was the International Year of the Forest, and the United Nations offered some good news. For the last two decades, total land area covered by forest in the Northern Hemisphere – where forestry is particularly active – has increased.
  • Wood is increasingly recognized as one of the most environmentally friendly building materials. At the University of Washington, researchers compared the environmental impact of building with either wood, concrete or steel. The hands-down winner for lower energy use, less waste and less water use was wood. While concrete and steel can only be mined once, trees are constantly replacing themselves.
  • In “The Lorax,” the Once-ler’s business collapses when all the trees are gone. Foresters understand this. Destroying a forest by cutting down every last tree makes no sense, so there are more trees in American forests today than there were just a few decades ago. Replanting isn’t just good for the environment, it’s good for business.

Forty years after he sprung from the imagination of Dr. Seuss, the Lorax would be happy to see that, far from disappearing, many forests today are thriving. They are there because the real story of the forests has not been about an unending battle between the fictional Lorax and the hard-hearted Once-ler, but of a friendship that understands that both benefit from healthy forests future generations can enjoy.


Preserving the Ideal of a Property Owning Democracy: The 8th Annual Demographia International Housing Affordability Survey

www.dhi.pdf


EXECUTIVE SUMMARY

Rating Housing Affordability

The 8th Annual Demographia International Housing Affordability Survey covers 325 metropolitan markets in Australia, Canada, Hong Kong, Ireland, New Zealand, the United Kingdom and the United States. The Demographia International Housing Affordability Survey employs the “Median Multiple” (median house price divided by gross [before tax] annual median household income) to rate housing affordability (Table ES-1). The Median Multiple is widely used for evaluating urban markets, and has been recommended by the World Bank and the United Nations and is used by the Harvard University Joint Center on Housing.


More elaborate indicators, which mix housing affordability and mortgage affordability can mask the structural elements of house pricing are often not well understood outside the financial sector. Moreover, they provide only a “snapshot,” because interest rates can vary over the term of a mortgage; however the price paid for the house does not. The reality is that, if house prices double or triple relative to incomes, as has occurred in many severely unaffordable markets, mortgage payments will also be double or triple, whatever the interest rate.

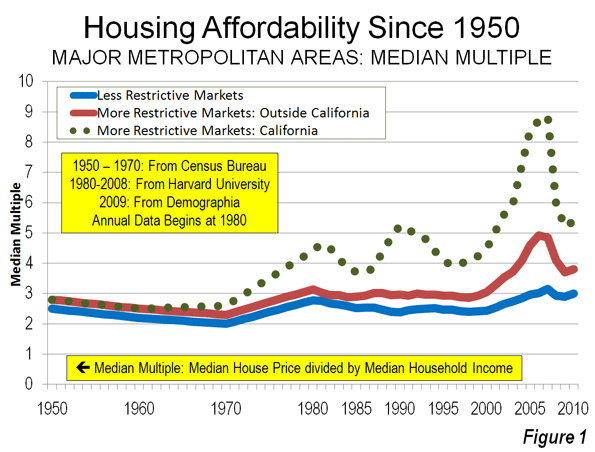
Historically, the Median Multiple has been remarkably similar in Australia, Canada, Ireland, New Zealand, the United Kingdom and the United States, with median house prices having generally been from 2.0 to 3.0 times median household incomes (historical data has not been identified for Hong Kong), with 3.0 being the outer bound of affordability. This affordability relationship continues in many housing markets of the United States and Canada. However, the Median Multiple has escalated sharply in the past decade in Australia, Ireland, New Zealand, and the United Kingdom and in some markets of Canada and the United States.

The Demographia International Housing Affordability Survey is produced to contrast the deterioration in housing affordability in some metropolitan markets with the preservation of affordability in other metropolitan areas. It is dedicated to younger generations who have right to expect they will live as well or better than their parents, but may not, in large part due to the higher cost of housing.

Housing Affordability in 2011

Housing affordability was little changed in 2011, with the most affordable markets being in the United States, Canada and Ireland. The United Kingdom, Australia and New Zealand continue to experience pervasive unaffordability.

Major Metropolitan Markets: The 325 markets include 81 major metropolitan markets (those with more than 1,000,000 population).

Among these major metropolitan markets, there were 24 affordable major markets, 20 moderately unaffordable major markets, 13 seriously unaffordable major markets and 24 severely unaffordable major markets. All of the affordable major markets were in the United States while three of the moderately unaffordable markets were in Canada and one in Ireland with the other 16 in the United States. The severely unaffordable major markets were principally in the United Kingdom (8), the United States (6), and Australia (5). Hong Kong was severely unaffordable and there were three severely unaffordable major markets in Canada and one in New Zealand (Table ES-2).


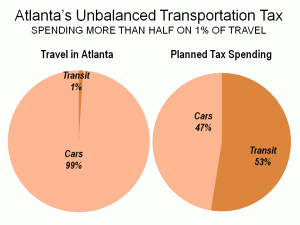
The most affordable major market was Detroit, with a Median Multiple of 1.4, below the historic range of 2.0 to 3.0. Atlanta had a Median Multiple of 1.9. The other 22 affordable major markets had Median Multiples of from 2.0 to 3.0, with the most affordable being Phoenix, Rochester, Cincinnati, Cleveland and Las Vegas. The strong growth markets of Dallas-Fort Worth, Houston, Orlando, Jacksonville, Nashville, Oklahoma City, Sacramento and Indianapolis also achieved affordable ratings.

All major markets in Australia and New Zealand, as well as Hong Kong were severely unaffordable. Hong Kong was the least affordable major market (ranked 81st), with a median multiple of 12.6. Vancouver was second most unaffordable, at a Median Multiple of 10.6 (ranked 80th), which is even more severely unaffordable than last year. Sydney was the third most unaffordable, at 9.2 (ranked 79th). Melbourne and Plymouth & Devon all had Median Multiples of more than 7.0.

All Markets: Among all 325 markets surveyed, there were 128 affordable markets, 117 in the United States, 9 in Canada and 2 in Ireland. There were 87 moderately unaffordable markets, 64 in the United States, 19 in Canada, 3 in Ireland and 1 in the United Kingdom. There were 39 seriously unaffordable markets and 71 severely unaffordable markets. Australia had 25 severely unaffordable markets, followed by the United Kingdom with 20 and the United States with 14. Canada had 6 severely unaffordable markets, while New Zealand had 5. China’s one included market, Hong Kong, was also severely unaffordable (Table ES-3). Honolulu and Bournemouth & Dorsett were the most unaffordable markets outside the major metropolitan markets, with a Median Multiple of 8.7.

Housing Affordability: Incompatible with Restrictive Regulation

The deterioration of housing affordability in many of the markets rated in the Demographia International Housing Affordability Survey is unprecedented based upon the available historical data. Australia and New Zealand, for example, which had legendary housing affordability from after World War II to the 1980s and 1990s have seen house prices reach levels that are nearly double even nearly triple their historic ratio to household incomes.

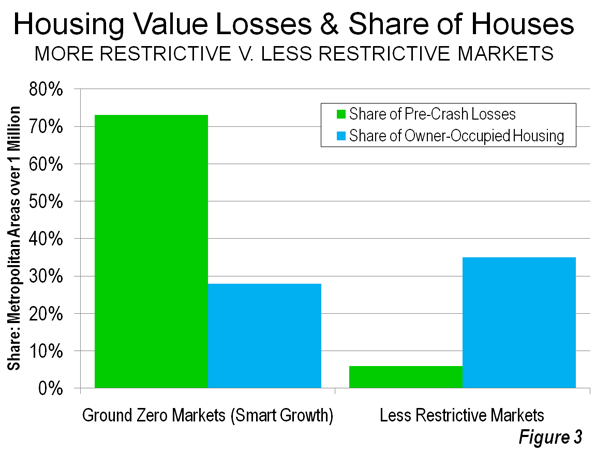
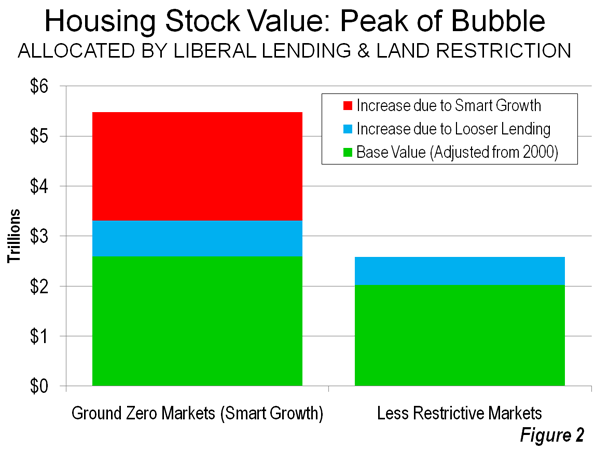
The economic evidence indicates that this trend is strongly related to the implementation of more restrictive land use regulations, especially measures that create scarcity in land for housing. In creating scarcity, more restrictive land regulation increases land prices, which increases house prices. In considering this process, economist Anthony Downs, of The Brookings Institution in Washington. D.C., has indicated the importance of maintaining the “principle of competitive land supply.” This is particularly important because one of the most favored more restrictive land use policies is the “urban growth boundary,” which prohibits development on considerable amounts of land that would otherwise be developable, resulting in artificial and unnecessary scarcity values. The escalation of house prices relative to incomes, from Sydney and Vancouver to London and across California testify to the failure of planning to maintain a competitive land supply. The record shows that smart growth (urban consolidation and compact cities policies) is incompatible with housing affordability.

More restrictive regulation has led to situations where “across the road” values per hectare of raw, developable land vary by more than 10 times in Auckland and Portland, based upon whether they are inside or outside the urban growth boundary. And these “urban echo values” at these locations (pricing in anticipation of future urban zoning) are generally substantially higher than the true rural values, further out from the urban growth boundary. Even larger differences have been documented in the United Kingdom’s Barker Report and researchers at the London School of Economics.

Further, economic analyses have indicated that metropolitan areas with more restrictive land use regulation tend to perform less well economically than would have been otherwise expected.

Preserving the “Ideal of a Property Owning Democracy”

One of the principal accomplishments of high-income world societies has been the expansion of property ownership and home ownership to the majority of the population. At the same time, there are dark economic clouds on the horizon. Governments in high income nations are faced with some of the most challenging times in their history. In this environment, the property owning middle-class seems likely to have to face significant challenges in the longer run. Housing represents the largest share of household budgets and thus, housing affordability is a major determinant of both the cost of living and the standard of living.

There are important positive signs. The state of Florida repealed its more restrictive regulations (“smart growth” law) in 2011. A major report released in December 2011 in New Zealand documented the importance of a competitive land supply in restoring housing affordability to that nation.

These are important first steps. There are serious social risks to more restrictive regulation and unnecessarily denying households the opportunity to own their own homes. In writing on the issue 40 years ago, urbanologist Peter Hall expressed concern about the effect of such policies on the “ideal of a property owning democracy.”

Green Policies, Bad Results

We at the NCPA have for a number of years written about how public policies and private actions intended to protect the environment often end up causing environmental harm.  Such unintended consequences continue to this day.

We first warned of the misguided policies that harmed the natural environment in our national parks and national forests in 1986.  We followed up on those themes a number of times, most recently in 2007 in a study which, among other things, documented how failed federal forest management has resulted in the huge forest fires that have become so frequent in recent years.

The same study also showed how federal policies have encouraged overharvesting of ocean fish stocks lead to the near collapse of the ocean fisheries.

Another study examined how federal policies have resulted in environmental destruction on the nation’s coasts and farmlands and have encouraged the destruction of wetlands.

In addition, the NCPA has written extensively on how subsidies and mandates for green energy, including wind power and solar power result in a variety of environmental ills.

Now comes an odd story of how building energy efficiency upgrades – like the ones touted by President Obama during his recent State of the Union Address – can result in expensive unintended consequences.  It is fairly widely recognized that indoor air is up to five times more polluted than outdoor air.  And the more efficient the home, the worse the problem since efficient homes don’t let air flow from outside but rather recycle the same polluted air over and over.  Now a new problem, specifically with energy efficient windows has come to light.  In California journalists have confirmed and the National Association of Homebuilders is investigating the case of a Prius owner who have found parts of her car melted by the sunbeams reflected off of a neighboring condo’s energy efficient windows.  I’ve experience the ability of reflective windows to blind drivers on the highway, but I never worried about them melting my car.  Does insurance cover that?

Why Housing is So Expensive in Metropolitan Washington

Anyone familiar with housing affordability in the Washington (DC-VA-MD-WV) metropolitan area is aware that prices have risen strongly relative to incomes in the last decade

However, a recent Washington Post commentary by Roger K. Lewis both exaggerates the contribution of higher construction costs and misses the principal factor that has driven up the price of housing — more restrictive land-use regulations.

Lewis compares construction costs in the early 1970s to current costs and finds that they are approximately 6 times as high. In fact, however, when the R. S. Means construction cost index for locations in the metropolitan area are adjusted for inflation, the increase is more like 15% (1970 to 2007).

Lewis also indicates that construction costs have risen faster than the “relatively flat income curve.” In contrast, Census Bureau data indicate that median household incomes in the Washington metropolitan area have increased more than 30% since the early 1970s, after adjustment for inflation. House construction costs are the flatter of the two, not incomes.

While Lewis’ focus is affordable housing, costs in this low income sector are impacted by many of the same factors that drive overall housing affordability (overall house prices relative to incomes).

Lewis does not consider the huge cost increase in the non-construction costs of housing. In the Washington metropolitan area, we have estimated that the land and the regulatory costs for a new house have been driven to more than 5.5 times the level that would be expected in a normal regulatory environment (see the Demographia Residential Land & Regulation Cost Index). The problem is that the restrictive land-use policies, such as the Montgomery County agricultural reserve, similar regulations in other metropolitan area counties and the large lot building restrictions in Loudoun County have driven the price of land up substantially, and with it, the price of housing. We estimate that more restrictive land use regulations have driven the price of a new house up approximately $75,000.

Not surprisingly, Washington’s Median Multiple (median house price divided by median household income) remains more than a third above the 3.0 historic norm, at 4.0, even after the burst of the housing bubble. So long as governments in the Washington, DC area continue to strictly ration land for development, higher than necessary costs will continue to plague both housing affordability and affordable housing.

The Social Costs of Smart Growth (Urban Containment)

“Soaring” land and house prices “certainly represent the biggest single failure” of smart growth, which has contributed to an increase in prices that is unprecedented in history. While this finding could well have been from our NCPA Policy Report, The Housing Crash and Smart Growth, they were actually from one of the world’s leading urbanologists, Sir Peter Hall, in the classic work he led on urban containment planning (a principal strategy of smart growth) 40 years ago. Hall led an evaluation of the effects of the British Town and Country Planning Act of 1947 (The Containment of Urban England) between 1966 and 1971. The principal purpose of the Act had been urban containment, using the land rationing strategies of today’s smart growth, such as urban growth boundaries and comprehensive plans that forbid development on large swaths of land that would otherwise be developable.

The Economics of Urban Containment (Smart Growth): The findings of Hall and his colleagues were just the beginning. A Labour Government report in the mid-2000s showed that housing affordability had been even further retarded by the policies. The author, Kate Barker was a member of the Monetary Policy Committee of the Bank of England, which like America’s Federal Reserve Board, is in charge of monetary policy. Among other things, the Barker Reports on housing and land use found that urban containment had driven the price of land with “planning permission” to 250 times (per acre) that of comparable land on which planning was prohibited. Under normal circumstances comparable land would have similar value.

The economic research is by no means limited to Hall and Barker, rather it is overwhelming. From left to right, economists have shown stronger land use regulation tends to raise land (and thus house) prices. Just like water tends to run downhill, prices tend to rise when supply is restricted, all things being equal. This is why the world so nervously watches OPEC fearing the supply constraints that generate higher oil prices. Moreover, there can be no other reason for the price differentials virtually across the street that occur in smart growth areas. Dr. Arthur Grimes, Chairman of the Board of New Zealand’s central bank (the Reserve Bank of New Zealand), found the differential on either side of Auckland’s urban growth boundary at 10 times, while we found an 11 times difference in Portland across the urban growth boundary.

House Prices in America: The Historical Norm: Since World War II, median house prices in US metropolitan areas have generally been between 2.0 and 3.0 times median household incomes (a measure called the Median Multiple). This included California until 1970 (Figure 1). After that, housing became unaffordable in California, averaging nearly 1.5 times that of the rest of the nation during the 1980s and 1990s (adjusted for incomes). Even after the huge price declines from the peak of the bubble, house prices remain artificially high in Los Angeles, San Francisco, San Diego and San Jose, at double historic norms.

William Fischel of Dartmouth University examined a variety of justifications for the disproportionate rise of California housing prices and dismissed all but more restrictive land use regulation. He noted that “growth controls (restrictive land use regulations) have the undesirable effect of raising housing prices.” Throughout the rest of the nation, more restrictive land use regulations have been present in every market where house prices rose substantially above the historic Median Multiple norm, even during the housing bubble. No market without smart growth has ever reached these price heights.

Setting Up for the Fall: Excessive Cost Increases in Smart Growth Markets: The Housing Crash and Smart Growth, published by the National Center for Policy Analysis, examined the causes of house price increase during the housing bubble. The analysis included all metropolitan areas with more than 1,000,000 population. It focused on 11 metropolitan areas in which the greatest cost increases occurred (the 11 “ground zero” markets, Los Angeles, San Francisco, San Diego, San Jose, Sacramento, Riverside – San Bernardino, Las Vegas, Phoenix, Tampa – St. Petersburg, Miami and the Washington, DC metropolitan areas), comparing them to cost increases in the 22 metropolitan areas with less restrictive land use regulation.

• Less Restrictively Regulated Markets: In the less restrictively regulated markets, the value of the housing stock rose approximately $560 billion, or 28 percent from 2000 to the peak of the bubble. In nearly all of these markets, the Median Multiple remained within the historical range of 2.0 to 3.0 and none approached the high Median Multiples that occurred in the “ground zero” markets.

• Ground Zero Markets The value of the housing stock rose $2.9 trillion from 2000 to the peak of the bubble in the “ground zero” markets, all of which have significant land use restrictions. The 112 percent increase in the “ground zero” markets was four times that of the less restrictively regulated markets. The Median Multiple rose to unprecedented levels in each of the “ground zero” markets, peaking at from 5.0 to more than 11.0, double to four times the historic norm.

The 28 percent increase in relative house value that occurred in the less restrictively regulated markets (those without smart growth) is attributed to the influence of loosened lending standards. The excess above 28 percent, which amounts to $2.2 in the “ground zero” markets is attributed to smart growth.

The underlying demand for housing was substantial in some of the less restrictively markets, which is illustrated by the strong net domestic migration to metropolitan areas such as Atlanta, Austin, Dallas – Fort Worth, Houston, Raleigh and San Antonio. At the same time, some more restrictive markets (smart growth) that hit historically experienced strong demand were experiencing huge domestic outmigration, indicating little in underlying demand. This includes Los Angeles, San Francisco, San Diego and San Jose. Demand, however is driven upward in more restrictively metropolitan areas by speculation which, according to the Federal Reserve Bank of Dallas is attracted by supply constraints.

The Fall: Smart Growth Losses

The largest house price drops occurred in the markets that had experienced the greatest cost escalation. This is not only to be expected from a perspective of probability, but is also indicative of the greater price volatility of more restrictively regulated markets as shown by economists Edward Glaeser and Joseph Gyourko. The “ground zero” markets, with only 28 percent of the owner occupied housing stock, accounted for 73 percent of the pre-crash losses ($1.8 trillion). Thus, much of the cause of the housing crash, which most analysts date from the Lehman Brothers bankruptcy (September 15, 2008), can be attributed to these 11 metropolitan areas.

By contrast, the 22 less restrictively regulated markets accounted for only six percent ($0.16 trillion) of the pre-crash losses. These 22 markets represented 35 percent of the owned housing stock (Figure 3).

If the losses in the ground zero markets had been limited to the rate in the less restrictively regulated markets (the estimated impact of cheap credit), lenders would have lost $1.6 trillion less. The Great Financial Crisis might not have been so “Great.”

Economic Denial and Acknowledgement: Dr. Hall noted that English planners denied the connection between the unprecedented house price increases and urban containment. The same economic denial is found among smart growth advocates today. This is perhaps to be expected, because, as Hall noted 40 years ago, an understanding of the longer term consequences could have undermined support for urban containment.

To their credit, some advocates recognize that smart growth raises house prices. The Costs of Sprawl – 2000¸ a volume largely sympathetic to smart growth, also indicates that urban containment strategies can raise housing prices. The only question is how much smart growth raises house prices. The presence of urban containment policy is the distinguishing characteristic of metropolitan markets where prices have escalated well beyond the historic norm.

The Social Costs of Smart Growth: Moreover, the social impacts of smart growth are by no means equitable. Peter Hall says that the “less affluent house – owner … has paid the greatest price for (urban) containment.” He continues: “there can be little doubt about the identity of the group that has got the poorest bargain. It is the really depressed class in the housing market: the poorer members of the privately – rented housing sector.” Finally, Hall laments the fact that the result contravenes the “ideal of a property owning democracy.”

Hall’s four decades old concern strikes a chord on this side of the Atlantic. Just last week, a New York Times/CBS News poll found that nine out of ten respondents associated property ownership in the form of a home with the American Dream.

Adapted from an article in newgeography.com