Category: Land Issues

Government Programs Hurt the Environment

The NCPA has written numerous times about various government agencies and programs that are supposed to protect or promote environmental quality but which result in environmental harm.  For instance:

Federally subsidized flood insurance;

Federal mismanagement of public lands;

Federal  endangered species policies;

Federal promotion of ethanol, wind and solar power;

Federal agriculture subsidies;

And Federal mismanagement of ocean fisheries.

Now, on a single day, I have been given the gift of multiple news reports each detailing new ways the government is hurting the environment while purporting to save it.

On how government ethanol subsidies and mandates  are destroying the prairies.

On how government subsidized and required solar power is competing with wind power to slay birds – combine the two and we really could have the Silent Spring Racheal Carson wrote about, just not from chemicals as she opined.

But Washington is not the sole source of environmental decline, other researchers and government officials think it’s a good idea to kill animals to study (the world’s oldest animal was killed to determine its age) or to save them (slaughtering thousands of chickens in order to save some few of them from the possibility of dying in the chicken fight ring).

Folks, I could make this stuff up, but I don’t have too.  And this is the same government we’re supposed to trust when it says there are no death panels in the health care law?

National Legal and Policy Center: Stimulus Program Delivered Free Trees to Rich People…and a Reporter

NLPC has reported regularly on several of the large-ticket boondoggles that have received taxpayer support via President Obama’s “green” stimulus initiatives, but for every Fisker, Nissan Leaf or Ecotality, there are thousands of smaller, equally unworthy beneficiaries that deserve public scorn.

Government watchdogs – both “professional” and amateur – can scour the Recovery.gov Web site and find the waste pretty easily. But KCNC-TV reporter Brian Maass had the stimulus program come to his doorstep. Denver had launched a program, paid for out of the federal American Recovery and Reinvestment Act, to plant about 4,000 trees at private residences (photo courtesy KCNC) – many in high-priced neighborhoods that didn’t need the free shade.

“This fella said, ‘How would you like to have a tree in your yard?’ And I said, ‘Really?,’” said John Backlund, who lives in Denver’s Cherry Creek North neighborhood in a home worth more than $700,000, in a report Maass filed for the local CBS affiliate. “Too good of a deal to say no to. I was happy to get the free tree.”

Maass’s own experience wasn’t that direct. He said last summer he requested and received a tree through a different city program, funded by local property taxes, in which a resident picks up a tree and plants it in front of his home in the right-of-way, usually between the sidewalk and street.

But weeks later Maass said a city parks and recreation department employee came into his yard and started marking where underground utility lines were for the purpose of planting a tree. Maass informed the worker that he already got his tree, but the employee said this tree was under another program and that Maass applied for it – which he could not remember doing!

“They had so many trees to give away,” Maass told NLPC in an email, “I think they borrowed from that other government list figuring if those people were planting trees in the right-of-way, then maybe they also needed a tree in their front yard. They have acknowledged there was some ‘cross pollination’ between those lists.”

So Maass allowed the city employee to proceed, and got his tree planted, but he said as the “process wore on” he investigated further and discovered the trees – and thousands of others – were paid for from the Recovery Act. It may be the easiest reporter’s tip in the history of journalism.

“A CBS4 investigation found that the tree program had no income guidelines,” Maass reported, “so trees ended up being planted at homes in Denver’s Country Club neighborhood, Hilltop, Belcaro and Washington Park neighborhoods — all considered upscale areas of the city.”

The city’s forester confirmed the program is “open to anybody” and about $600,000 was spent to buy and plant the trees. Maass said he was told the way the program stimulates the economy was to use the government funds to create jobs planting trees. The concept is reminiscent of the phony scenario concocted last year by Project Veritas undercover video maker James O’Keefe, who tried to promote a company that just dug holes and filled them back in as one that could be eligible for stimulus money. He was able to gain sympathetic support from New York union bosses who admitted green jobs are “bull****,” but that the make-work is a legitimate use for taxpayer funds.

“I think as long as people are working, that’s not bull,” the union leader said. “You know what I mean? Then you’re doing a service.”

As for the tree program, it was part of a $6.1 million stimulus grant to the City and County of Denver for a myriad of initiatives, in which they were to be “strategically planted…to shade homes.” According to reports compiled at Recovery.gov one of the contractors, T2 Construction, tasked with the “strategic placement” of trees to reduce energy use, was paid $76,044 for the project. The city reported to Recovery.gov that tree planting created .73 “jobs” for the fourth quarter of 2012. Maybe in 10 years the trees will have grown enough to take a couple dollars off residents’ electric bills.

The planting of the trees was not the only make-work under the $6 million grant. There also was (were?) the Denver bureaucrat(s) who did the administrative work to determine that residents like Maass were looking for trees. Because, apparently, no one was demanding any of the 4,000 trees allocated from the stimulus grant, city workers had to go out and find them – as with KCNC interviewee John Backlund. And with others, such as Maass, they likely just pulled from the city’s list of tree requesters from the right-of-way program and then told them they requested the stimulus trees.

“I asked program administrators repeatedly if they could show me or prove to me that I proactively applied,” Maass told NLPC. “They have not provided me that verification. So I am still not 100 percent sure how I ended up on their list.”

Adding insult to injury, according to a Colorado Watchdog report last summer, the Denver Housing Authority has cut down trees to install solar panels for its subsidized housing projects.

So voila! – more fractions of make-work jobs created by President Obama’s green energy stimulus. But there’s more! Besides planting trees (and cutting them down), Denver said the U.S. Department of Energy grant would also pay for initiatives such as: conducting energy audits and “recommissioning” existing City facilities; replacing 2,000 incandescent traffic signal lamps with LEDs; integrating the goals of the program to update the City’s Climate Action Plan; adopting energy efficiency building codes; providing financial incentives to small businesses who implement energy efficiency projects; expanding energy services provided to neighborhoods; and purchasing bicycles and kiosks for seven stations located near light rail stops “to better integrate Denver’s bike share system with public transit.”

Discerning eyes would recognize that most of the above activity is a waste of $6 million, with zero cost-benefit analysis conducted before implementation, and minimal accountability about the performance of such measures afterward. For example, if genuine energy savings are to be realized, then businesses and residents – if they want them bad enough – will pursue them on their own without need of a government incentive. On a policy level, the benefit realized from the implementation of the initiatives for the public is dubious at best.

In fact, on their face, it can be argued that some of the actions are ridiculously wasteful. The replacement and discard of perfectly working traffic signal bulbs with far more expensive LEDs, whose life span is not proven to be significantly superior, is foolish. Add the labor cost to replace all the lamps, and the more worthwhile activities those employees could be doing in their time, and you again come up with a “make-work” result.

The Denver block grant, funded by U.S. taxpayers, is the perfect example of how government’s intervention in private markets promotes waste and inefficiency. You can literally multiply this case by thousands of grants – and billions of dollars – that have been delivered to state and local governments from the stimulus.

Maass, to his credit, wanted no part of the scheme. He said he paid Denver’s government $150 for the tree that they can’t prove he requested.

Paul Chesser is an associate fellow for the National Legal and Policy Center and publishes CarolinaPlottHound.com, an aggregator of North Carolina news.

The Global Environmental Facility: Another Failed, Corrupt International Boondoggle

A new paper by the NCPA examines the U.N.’s Global Environmental Facility.  The United States has donated $1.24 billion to the GEF. Over the past five years, U.S. contributions have increased 61 percent.  The GEF was established to fund international projects to preserve biodiversity, prevent global warming, protect international waters, stop land degradation, save the ozone layer and remove persistent organic pollutants in less developed countries.

However, as with so many well-meaning, international efforts as the study details, the GEF is rife with corruption, sends most of its funding to wealthier, fast growing countries that could fund their own environmental efforts rather than the poorest countries that could really use the help, has little accountability, and appears immune to reform.

Concerning corruption, The GEF has been scandal-ridden. For instance:]

  • In 2007, the GEF was caught in procurement fraud in Africa worth $8 million; but when an official reported it, the United Nations retaliated against the whistleblower.
  • In the Philippines, the GEF was reportedly operated by an official who awarded grants to her own local nongovernment organization (NGO); then, diverted funds to enrich her family. When a U.N. employee blew the whistle, the United Nations covered it up.
  • The U.N. Development Program, which oversees the GEF, was investigated for illicitly giving funds to North Korea, and for their inability to account for $100 million designated for sustainable development projects.

The GEF has proven adept at one thing, transferring money from some rich countries to other rich countries – while leaving those countries most in need of environmental help begging for scraps.  The U.S. should not continue to throw good money after bad. This is not a program in need of reform – rather it needs to be scrapped entirely.

Portland Speeds to Transit Train Wreck?

For more than a quarter century, the leaders in the Oregon portion of the Portland metropolitan area have sought to transfer demand for urban travel from automobiles to transit. Six rail lines have been built, five of which are light rail and bus service has been expanded. If their vision were legitimate, transit’s market share should have risen substantially and automobile travel should have declined. Neither happened.

Light Rail, Commuter Rail and Trolleys Added, Transit Market Share Declines

The results have been modest, to say the least. Since 1980, before the first rail line was opened, transit’s share of work trip travel in the metropolitan area has declined by one-quarter, from 8.4 percent to 6.3 percent in 2011(even after opening a commuter rail line and adding downtown trolleys). Overall, the share of travel by car remains about the same as before the first light rail line opened (based upon data from the Texas Transportation Institute and the Federal Transit Administration).

Other Light Rail Cities Mirror Portland’s Transit Market Share Decline

And, while Portland’s transit performance falls far short of its hyper-promotion (around the world), other cities that have built light rail have also lost transit market share. Between 1990 and 2011, transit’s market share in Dallas-Fort Worth dropped 42 percent. St. Louis dropped 20 percent over the same period. Houston, which began building later, lost more than a quarter of its transit market share from 2000 to 2011. Each of these cities had miniscule transit shares (even smaller than Portland’s), both before light rail and after.

Transit is about Downtown

Transit access to destinations outside downtown Portland remains scant. Despite the huge expenditures on transit, only 8 percent of the jobs in the metropolitan area can be reached by the average employee in 45 minutes, despite the fact that nearly 85 percent of workers are within walking distance of the transit stops or stations. Portland’s transit access is better than the national major metropolitan average of six percent.

But Portland trails a number of other metropolitan areas and is well behind the best, Milwaukee, Wisconsin. Even Milwaukee’s transit access, however, is “nothing to write home about,” at only 14 percent. This makes a mockery of the “transit access” measure used by many planning agencies. Being close to a transit stop or station is of little help if service to the desired destination is not available or takes too much time.

According to the latest American Community Survey data, the average work trip by people driving alone in Portland is 23.6 minutes, while the average commute trip by transit is 43.8 minutes. It is no wonder that transit ridership is so low. Few who have a choice will opt for spending an additional three hours more than necessary per week commuting.

Draconian Service Cuts Threatened

Further, Portland transit users could face draconian service reductions. Tri-Met, which operates light rail and most Oregon services, has warned that it may be required eventually to cut 70 percent of its service. This results from the failure to control labor costs, particularly pension costs, which is detailed in an Oregonian article. John Charles, president of the Cascade Policy Institute found that $1.63 all the benefits were being paid out for every dollar of wages, a claim confirmed by PolitiFact. The concern extends to the state capital, where the legislature has overwhelmingly approved a bill requiring an audit of Tri-Met by the Secretary of State.

The Clackamas County Voter Revolt

Tri-Met continues to expand light rail, but with some “pushback.” An under-construction line to Milwaukie evoked such controversy in Clackamas County, that voters elected an anti-light rail majority to the county commission. Voters have banned light rail expenditures without a public vote in the suburban municipalities of Tigard and King City. Clark County (Washington), voters rejected funding for a light rail connection to the Portland system. This opposition was at the heart of defunding a replacement Interstate 5 bridge over the Columbia River. The project recently closed after spending $175 million (see Project Closing Notice).

Were the Former Days Better than These?

With the investment and expansions, these should have been the halcyon days of transit in Portland. The future could be even more challenging.

Job Dispersion in US Metropolitan Areas

The continuing dispersion of employment in the nation’s major metropolitan areas has received attention in two recent reports. The Brookings Institution has publishedresearch showing that employment dispersion continued between 2000 and 2010, finding job growth was greater outside a three mile radius from central business districts between 2000 and 2010 in 100 metropolitan areas Note 1). This assessment probably underestimates the extent of job dispersion, since it includes some suburban centers as central business districts (such as West Palm Beach, FL and Palo Alto, CA).

Recently I showed that employment dispersion has reached a point that there is a virtual balance of jobs and housing in suburban areas, which contrasts with the continuing excess of jobs in core municipalities relative to resident workers. After that article was published, Richard L. Forstall forwarded me research he presented to the Southern Demographic Association in the 1990s that examined employment trends in core municipalities and suburban areas between 1960 and 1990. At the time, Forstall was at the United States Bureau of the Census. He also spent years supervising Rand McNally international metropolitan area population estimates (Note 2).

Major Metropolitan Job Dispersion: 1950 to 2010 and

Forstall provides detailed information for the 35 major metropolitan areas as of 1990 (over 1,000,000 population). This article augments the Forstall research with data from the 2010 census (Note 3).

Consistent with both national and international trends, the half century between 1960 and 2010 indicated significant dispersion in metropolitan areas. This, of course, was a continuation of a trend that accelerated from the first quarter of the 19th century, when early mass transit systems allowed people to live in larger spaces, farther away from their work.

The movement of residents from the urban core to the suburbs followed the even greater exodus from small towns and rural areas. But it was not long before residents of the homogeneous bedroom suburbs of the 1950s began to find more nearby employment opportunities.

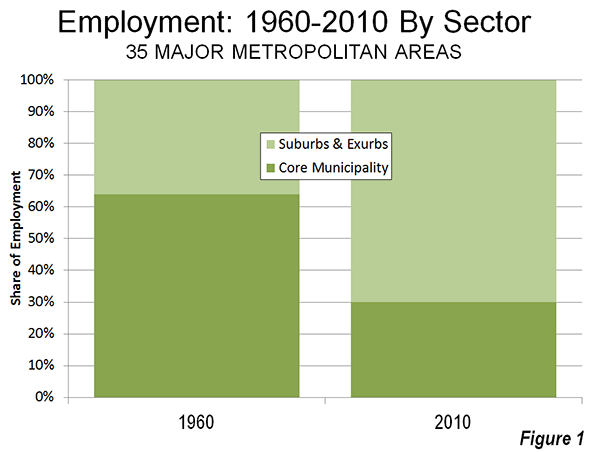
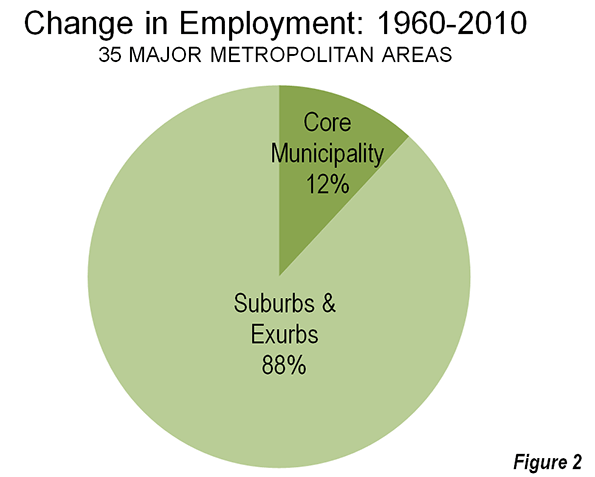
In 1960, 54% of the employment in the 35 major metropolitan areas was in the historical core municipalities, with the balance of 46% of the jobs in suburban and exurban areas. By 2010, the corner municipality share had dropped to 30%, while suburban and exurban areas contained 70% of the employment (Figure 1). Between 1960 and 2010, 88% of the new jobs were in the suburbs and exurbs, leaving only 12% of the growth in the core municipalities (Figure 2).

Dispersion Greater in Metropolitan Areas with Pre-War Non-Suburban Cores

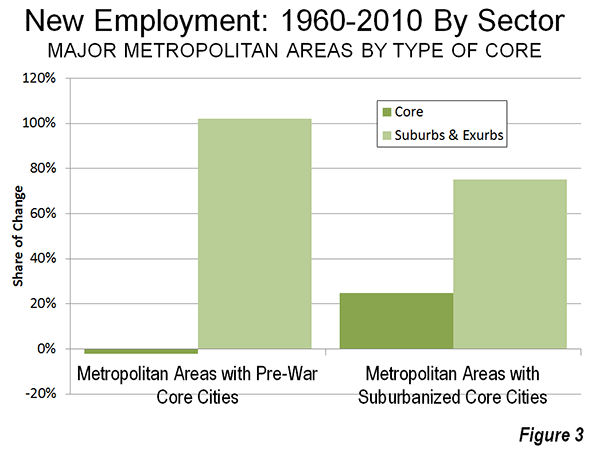
However, even this distribution appears to mask an even greater dispersion. Among the metropolitan areas with “Pre-war non-suburban core municipalities,” (such as San Francisco, Baltimore, Providence, New York, etc.) a full 102% of job growth was in suburban and exurban areas. Core city employment accounted for a minus two percent of employment growth (in other words, it declined). These are metropolitan areas with core cities that were virtually fully developed before World War II and which have added little to their land areas by annexation.

The other metropolitan areas have core cities with large swaths of suburbanization and some, like Phoenix and Sacramento are virtually all suburban. In these metropolitan areas, approximately 25% of the job growth since 1960 has been in the core cities (Figure 3).

Pre-War Non-Suburban Core Municipalities Losses and Gains

Among the 18 metropolitan areas with “Prewar non-suburban” core municipalities, two thirds experienced losses in their core cities. The Rust Belt “ground zero” core cities of Detroit, Cleveland, and Buffalo all lost 40 percent or more of their employment, and were joined by second tier Rust Belter St. Louis. The core city of Pittsburgh, typically one of the Rust Belt’s big four, did much better, losing only five percent of its employment. Across the state, however, the core city of Philadelphia did much worse, dropping 23 percent of its employment. The core city of Chicago lost 20 percent of its employment.

Perhaps most notable was the core city of Hartford, which lost 9 percent of its employment between 1960 and 2010. According to data in the Brookings Institution Global Metro MonitorHartford has emerged as the world’s most affluent major metropolitan area (measured by gross domestic product per capita) over the same period. All of Hartford’s job growth was in the suburbs and exurbs.

The core city of New York did the best among the metropolitan areas with “Pre-War non-suburban” cores, attracting 16 percent of the employment growth over the half-century. Washington (DC) also did well, with a 12 percent share of new employment.

Urban Dispersion and the Quality of Life

The dispersed metropolitan area, along with its comprehensive roadway networks, has served the US well, especially in two important measures of the quality of life — housing affordability and mobility. Major metropolitan areas in the United States have some of the most affordable housing in the high-income world. The US has shorter work trip travel times than Canada or Western Europe and much shorter than the major metropolitan areas of Japan (with the most comprehensive rail systems in the world) and East Asia.

This advantage was reiterated with the recent release of the Tom Tom Congestion Index, which showed traffic congestion in the metropolitan areas of Australia and New Zealand to be far worse than in US metropolitan areas of similar size. For example, Sydney is as congested as Los Angeles, despite having only one-third the population. Auckland (New Zealand) has worse traffic congestion than any US metropolitan area of similar size.

Peter Gordon and Harry W. Richardson spotted this advantage nearly two decades ago (See Are Compact Cities a Desirable Planning Goal?), before there was international traffic congestion comparison data. Based upon their review of national travel surveys, they concluded:

Suburbanization has been the dominant and successful mechanism for reducing congestion. It has shifted road and highway demand to less congested routes and away from core areas.

Wendell Cox is a Visiting Professor, Conservatoire National des Arts et Metiers, Paris and the author of “War on the Dream: How Anti-Sprawl Policy Threatens the Quality of Life.

——-

Note 1: The Brookings Institution report indicates that employment within a 3 mile radius of downtown (the central business district) increased in number and share only in the Washington, DC metropolitan area. However, this may not indicate an increase in central business district (downtown) employment. The large, nearby, but suburban employment centers of Rosslyn, Crystal City and downtown Alexandria may be located within the three mile radius (the report does not indicate the point from which the radius is drawn). The three mile radius used in the report is useful and represents the best reported data. However, it may not be representative of central business district employment encloses a huge area (28 square miles), which is more than 25 times the typical central business district geographical size and larger than the land areas of the core cities of Providence and Hartford and nearly two-thirds the size of the core city of San Francisco. Transit commuting to such nearby employment centers is routinely far lower than the share that ride transit to downtown.

Note 2: Forstall is co-author (with Richard P. Greene and James B. Pick of seminal research that estimated the population densities of the largest metropolitan areas in the world (Which Are the Largest: Why Lists of Metropolitan Areas Vary So Greatly). Normally, metropolitan area densities cannot be validly compared because of widely varying criteria between nations. Further, in the United States, metropolitan area densities are nonsensical, because their building blocks vary in size too much. With its County-based definitions, US metropolitan areas include building blocks ranging from half the size of Orlando’s Walt Disney World (New York County, or Manhattan borough) to the size of the nation of Costa Rica (San Bernardino County). The use of such a crude building block results in the inclusion of huge amounts of rural territory that is outside the labor market or the commuting shed (metropolitan areas are typically defined as labor markets). Forstall and his coauthors applied criteria that was both consistent and rational. This exhaustive process limited the number of metropolitan areas for which they were able to make estimates to 28.

Note 3: This analysis differs from Forstall’s approach in defining core cities using the historical core municipality classification. It should be noted that there have been changes in metropolitan definitions over the 50 years.

From http://www.newgeography.com/content/003663-job-dispersion-major-us-metropolitan-areas-1960-2010

Photo: Suburban employment in Chicago (by author)

Sydney to Abandon Radical Smart Growth Policy

Australia’s New South Wales state government has proposed a new Metropolitan Strategy for the Sydney area which would significantly weaken its highly restrictive smart growth policy (also called urban containment, smart growth, livability, growth management, densification, etc.) that has driven if house prices to among the highest in the affluent New World (Australia, Canada, New Zealand and the United States) relative to household incomes.

According to the Australian Financial Review, the Liberal-National government plans to allow the building of more than 170,000 new homes, with the vast majority being on greenfield sites, largely beyond the current urban footprint. Premier Barry O’Farrell and his party had promised in their electoral campaign in 2011 to liberalize land-use regulation and to moderate the previous Labor government’s quota that required 70% of new houses to be built within the current urban footprint and 30% on greenfield sites. In fact, however, under the Labor government’s administration, new house building had been produced at a well below demand level.

Among the major New World metropolitan areas rated in annual Demographia International Housing Affordability Surveys, Sydney has been the most unaffordable, along with Vancouver, in recent years. Sydney and Vancouver have had among the most stringent urban containment policies in the New World, and the resulting unaffordable house prices under such circumstances are consistent with economic principle.

Premier O’Farrell told the Sydney Morning Herald said the government wanted to “make home ownership a reality again” He continued “The more blocks of land (lots) we can release, the greater downward pressure we can put on housing because it’s been so high for so long.” In a press release issued by his office, the Premier recalled that ” Before the election, I said I wanted to ensure owning a home wasn’t a fading dream for young families” and noted that the massive housing package “will go a long way to delivering on that commitment.”

In the longer run (by 2031), the government intends to provide for a total of 545,000 new homes, while abandoning the practice of allocating locations based upon planning theory. The overwhelming majority of these homes are likely to be built in greenfield areas on or beyond the urban fringe, rather than in urban infill.

Planning and Infrastructure Minister Bradley Hazzard told the Sydney Morning Herald that the government intended to “‘look further afield” then the presently planned greenfield suburban growth centers. He continued: “‘We’re trying to [be] less constrictive and restrictive and what we’re saying is the marketplace should have far more of a say in what the mix of housing is and where it should be,” adding that ”it doesn’t matter” what percentage was delivered in greenfield and established suburbs. He concluded: ”No one should be preoccupied by particular prescriptive formulas.”

The government also indicated its intention to encourage one half of employment growth over the next 20 years to be in Western Sydney. Western Sydney is virtually across the urban area from the central business district. This dispersion of employment, along with roadway improvements in the area are likely to improve the metropolitan balance between jobs and housing.

The plan for greater job dispersion would, if successful, bring Sydney more into line with urban best practices, which are exhibited by the location of most new jobs in edge cities, as well as throughout the entire urban area. Sydney has among the longest work trip travel times in the New World. The one-way work trip travel time is newly reported in the Metropolitan Strategy to have reached 35 minutes. Work trip travel times are worse only in Melbourne, at 36 minutes. By comparison, Dallas-Fort Worth, with a larger population, a much lower urban area density and a mere fraction of the Melbourne or Sydney transit work trip market share has a far shorter one-way work trip travel time (26 minutes).

The Sydney developments are the latest in a trend toward liberalizing urban land use in four nations.

In October, the New Zealand government announced plans to liberalize land-use amid growing concern about the extent to which that nation’s urban containment policies have destroyed housing affordability. In the introduction to the 9th Annual Demographia International Housing Affordability Survey, Deputy Premier Bill English said:

 Land has been made artificially scarce by regulation that locks up land for development. This regulation has made land supply unresponsive to demand. When demand shocks occur, as they did in the mid-2000s in New Zealand and around the world, much of that shock translates to higher prices rather than more houses.

 Recent polling has shown support, by an almost 2 to 1 margin for government action to improve housing affordability, with even higher stronger support in the 18 to 34 age group, where the margin was more than 3 to 1.

The United Kingdom Cameron government is also embarked on a program to liberalize that nation’s restrictive land use policies, which former Bank of England Monetary Policy Committee member Kate Barker found to be the cause of severe housing unaffordability in a report commissioned by the Blair Labour government. Planning Minister Nick Boles has characterized the unaffordability of housing as “the biggest social justice problem we have.”

In 2011, Florida repealed its statewide smart growth mandate and closed the administrative bureaucracy that had overseen the program. Before that, the government of the Australian state of Victoria substantially expanded the urban growth boundary of the Melbourne urban area.

Adapted from an article at newgeography.com


Rare Earth Elements and Mining Get Attention on the Hill

There has been a flurry of action on Capitol Hill regarding the need to improve our knowledge of the amounts of rare earths in the country, our current resource needs, constraints and bottle-necks and need to streamline mining laws.  There is no easy link to this material so I post the full article below:

MINING:

Colo. Republican unveils bill to promote U.S. mineral development

Manuel Quinones, E&E reporter

Published: Wednesday, March 13, 2013

The chairman of the House Energy and Mineral Resources Subcommittee announced legislation yesterday that would make it U.S. policy to promote domestic availability and production of key mineral resources.

Colorado Republican Doug Lamborn’s measure, H.R. 1603, is one of several recently introduced bills aimed at tackling foreign dependence on rare earth elements and other materials necessary for economic or defense needs.

The legislation notes that by 2010, “United States import dependence for nonfuel mineral materials more than doubled from 30 to 67 commodities, 18 commodities were imported entirely to meet the Nation’s requirements, and another 25 commodities required imports of more than 50 percent.”

It adds, “[T]he United States lacks a coherent national policy to assure the availability of minerals essential to manufacturing, national economic well-being and security, agricultural production, and global economic competitiveness.”

The Lamborn bill calls on the Interior Department, working with a suite of federal agencies, to assess U.S. mineral capabilities and demands.

The legislation would also task Interior with studying the mineral potential in restricted areas, the permitting process and the impact of litigation on mine development. Progress reports would be due on efforts to expand access.

The new Lamborn bill appears to be an expanded version of H.R. 2011, which cleared the full Natural Resources Committee unanimously in 2011.

Democrats and conservation advocates have accused mining boosters of using the bills as a means of making the permitting process more lax and avoiding strict environmental scrutiny. The subcommittee will hear arguments during a hearing next week.

Related bills on the subpanel’s agenda:

  • H.R. 761, by Rep. Mark Amodei (R-Nev.), which would significantly streamline the mine permitting process, setting timelines and litigation limits (E&ENews PM, Feb. 15).
  • H.R. 981, by Reps. Hank Johnson (D-Ga.) and Ed Markey (D-Mass.), to boost knowledge of rare earth elements and their presence through new U.S. Geological Survey reviews (E&E Daily, March 7).
  • H.R. 687, by Arizona Reps. Ann Kirkpatrick (D) and Paul Gosar (R), which would authorize a land swap in the state to facilitate a large copper mine (Greenwire, Feb. 15).
  • H.R. 697, by Rep. Joe Heck (R-Nev.), to facilitate the cleanup of an abandoned and polluted manganese mine in the community of Henderson.
  • H.R. 767, by Rep. Kevin Cramer (R-N.D.), to include North Dakota and South Dakota in a federal streamlined permitting pilot program for oil and gas.
  • H.R. 957, by Rep. Cynthia Lummis (R-Wyo.), to lower the royalty rate for mining soda ash, promote the industry and allow it to compete with China.

Schedule: The hearing is Thursday, March 21, at 10 a.m. in 1334 Longworth.

Smart Growth/Urban Containment Continue to Drive Unaffordable Housing in 7 Nations

We have just released the 9th Annual Demographia International Housing Affordability Survey covering 337 metropolitan markets in Australia, Canada, China (Hong Kong), Ireland, New Zealand, the United Kingdom and the United States. As usual, the most unaffordable markets are those in with urban containment policy (also called by other names, such as smart growth and compact cities policy). The Survey uses the Median Multiple to evaluate housing affordability.

The Demographia International Housing Affordability Survey employs the “Median Multiple” (median house price divided by gross before tax annual median household income) to rate housing affordability (Table 1). The Median Multiple is widely used for evaluating urban markets, and has been recommended by the World Bank and the United Nations and is used by the Harvard University Joint Center on Housing.
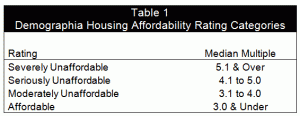
Historically, among the metropolitan areas outside Hong Kong, the Median Multiple was typically at 3.0 or below, before the adoption of urban containment policies. Urban containment policies ration land for development, and as economics would predict, this raises the price of land and thus the price of housing.

Severely Unaffordable Major Markets

The most unaffordable major markets (over 1,000,000 population) are Hong Kong, with a Median Multiple of 13.5, Vancouver with a median multiple of 9.5 and Sydney with a median multiple of 8.3 (Table 2).
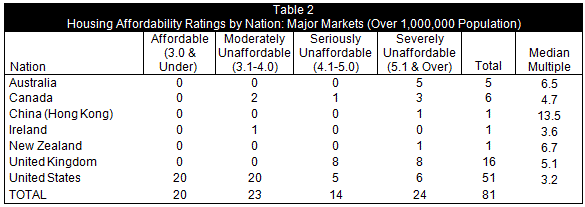
 

The most severely unaffordable US major markets (over 1 million population) are San Jose, at 7.9, San Francisco, at 7.8, San Diego, 6.4, New York, 6.2, Los Angeles, 6.2, and Boston, 5.1. Each of these markets experienced a substantial house price escalation during the housing bubble and a substantial loss in house prices when the bubble burst.

In Canada, both Toronto (5.9) and Montréal 5.1 were rated severely unaffordable, in addition to Vancouver.

All major markets in land rich Australia are rated severely unaffordable, including Sydney (9.3), Melbourne (7.5), Brisbane (5.8) , Perth (5.9) and slow-growing Adelaide (6.5). New Zealand’s only major market, Auckland is also rated severely unaffordable, at 6.7

Among metropolitan areas with less than 1 million population, Honolulu was the most unaffordable in the seven nations, at 9.3.

In the United Kingdom, London (7.8), the London exurbs (6.8), Plymouth (7.3), Bristol (5.7), economically depressed Liverpool (5.3), economically depressed Newcastle (5.2), Birmingham (5.1) and Sheffield (5.1) were also rated severely unaffordable.

Affordable Markets

At the same time, affordable markets remain, even in the metropolitan areas with the highest growth rates. For example, Dallas-Fort Worth, Houston and Atlanta, which are among the fastest-growing Metropolitan areas with more than 5 million people in the high income world, housing remains affordable. As has been the case throughout the nine years of the Survey, the most affordable housing has been in Metropolitan areas with the more traditional liberal land-use policies that have been replaced by urban containment policies in many metropolitan areas.

Understanding and Dealing with the Problem

The issue driving housing affordability is not demand. It is a supply problem driven by the destruction of the competitive land supply by overzealous land regulation. Former Reserve Bank of New Zealand Gov. Donald Brash squarely cited the cause in his introduction to the 4th Annual Demographia International Housing Affordability Survey who said that the one issue separating markets with housing affordability from on affordable housing “is the severity of the artificial restraints on the availability of land for residential building.”

Hon. Bill English, Deputy Prime Minister of New Zealand, who is leading an effort to reform his nation’s destructive policies, describes the problem further in his introduction to this year’s Survey:

 It costs too much and takes too long to build a house in New Zealand. Land has been made artificially scarce by regulation that locks up land for development. This regulation has made land supply unresponsive to demand. When demand shocks occur, as they did in the mid-2000s in New Zealand and around the world, much of that shock translates to higher prices rather than more houses.

 Housing Affordability and a Sustainable Economy

There has been increasing attention to the challenging demographic trends that could materially reduce future standards of living. Birth rates have plummeted, while the share of the population that is elderly has increased substantially. As a result, government financial obligations could overwhelm the ability of nations to pay. Higher than necessary housing costs would make it even more difficult to meet these obligations.

Further, surveys indicate that many households are having children later, or not at all because housing conducive to raising children is unaffordable. There are generally lower fertility rates in urban cores, with their higher density housing than in the more dispersed suburbs, with their detached and semi-detached housing.

But the consequences of stagnant or declining standards of living and rising poverty could be even greater. Harvard economist Harvard economist Benjamin Friedman concluded that continuing improvements in the quality of life are required for social sustainability, in his The Moral Consequences of Economic Growth.

Affordable housing is thus a critical component of economic sustainability. Yet, the “conventional wisdom” in land-use policy favors urban containment strategies that severely ration land for development, materially raising its price.

There are indications that perspectives are changing. New York University Professor Shlomo Angel writes in his book Planet of Cities of the importance of housing affordability and argues against  urban planning restrictions that restricting adequate housing to ordinary households.

A team of UK academic researchers has questioned the appropriateness of assuming that urban containment should be the default land use option. This is an important development, since much of urban planning is committed to outlawing more liberal land-use policies.

Urban policy needs a “reset.” The emphasis should be shifted away from “designing” urban areas to facilitating a better standard of living for the people who live in them. In his epic Civilization: The West and the Rest, historian Niall Ferguson, in his Civilization notes that “The success of the civilization is measured not just in its aesthetic achievements but also, and surely more importantly in the duration and quality of life of its citizens.” This requires greater affluence and less poverty, both of which require more affordable housing.
Trulia Provides Sub-County Population Estimates: Suburban Areas Continue to Grow Faster

Jeb Kolko, Chief Economist of the real estate website firm, Trulia has provided the only believable sub-county population change data available for 2010 to 2011. In a Trulia website posting republished at newgeography.com (Even After the Housing Bust, Americans Still Love the Suburbs), Kolko shows that household growth was generally greater in less dense areas than in the more dense areas in 45 of the 50 largest metropolitan areas in the nation.

The Bureau of the senses had released sub-county population estimates earlier this year. Chris Briem of the University of Pittsburgh quickly pointed out that the estimates were nothing more than allocation of previously developed county level estimates to municipalities and other sub – county areas based upon their share of the 2010 population (See: Misreferencing Misoverestimated Population).  I followed up a couple of months later with additional analysis in an article entitled 2011 Census Sub-County Allocations Masquerade as Population Estimates (both articles appeared on newgeography.com).

Meanwhile, in view of the fact that federal statistical data should be beyond reproach, it is disappointing that the Bureau of the Census has not withdrawn the invalid 2011 sub – county population estimates.


Seattle’s Dolphin Safe, “Green” Certified Forests

With any luck, Seattle’s urban forests will soon be certified dolphin safe. That may seem strange, but it would be just about as meaningful as the city recently receiving a forest certification it promises it will never use.

With predictable fanfare, the City of Seattle has announced its urban forests have received certification from the Forest Stewardship Council (FSC), stating that  the “Seattle park system meets the gold standard in environmentally friendly forestry.” City Hall’s senior forester Mark Mead noted “The FSC certification helps ensure we are doing the right things to assure a healthy and sustainable forest for Seattle.”

Advocates of the certification say the city can now sell any timber from the urban forests to consumers who want to know the timber came from a sustainably managed forest. FSC and other certification systems are typically associated with working forests where timber is being harvested and sold.

The City of Seattle, however, promises it won’t actually use the certification. “We want to be crystal clear that we don’t have a mandate to sell any timber,” says Mead. In fact, the City is so strident about this position, it promises to never to sell trees, even if they have fallen down. “The certification would allow us to sell it as FSC-certified timber, if we wanted to. But there’s infinitely more value in leaving a tree that falls,” said Michael Yadrick, an ecologist with Seattle Parks.

The certification report, which the City of Seattle paid $2,000 to complete, has little to say about forest management. The top concern of FSC assessors was the fact that “off-leash dogs are causing erosion” and other impacts. This isn’t a forestry issue, but an urban parks management issue.

Ironically, the FSC assessment does make one recommendation that contradicts Seattle Parks’ harvest policy. FSC auditors recommended that Seattle Parks “develop a local procurement policy for building and maintenance materials.” As FSC is telling Seattle to use local timber for building, Seattle is telling FSC they will do everything they can to make sure those local materials don’t come from its own lands.

This is not to say that Seattle Parks should be harvesting, but it highlights how useless it is to use the public’s money and paid staff time to receive certification for timber production the city promises will never occur.

So, why do it? The City of Seattle is quick to admit it is about image. Like so much of our environmental policy, the goal is to cultivate a green image for the city and its politicians, even if the effect of the policy on the environment is zero.

Seattle Parks may argue FSC certification ensures they are managing forests sustainably for the future, even if they don’t produce timber. This, however, is contradicted by the audit report. FSC auditors made no recommendations regarding forest management. The closest they came is when the audit notes Seattle Parks “should give consideration” to creating a range of tree ages in urban forests.

Receiving FSC certification – a certification that added no new knowledge and won’t be used and actually contradicts Seattle Park’s forest policy – is about as useful as receiving a dolphin safe certification. Although, we imagine they will also be concerned about “fecal contamination” from off-leash dogs.