Author Archive

Powerwall or Powerdream?

Elon Musk recently introduced Tesla Motor’s new battery power product for the home. The Powerwall is a lithium-ion battery that is four feet tall, three feet wide and seven inches deep. The goal of the new battery is to offer superior solar powered energy independence. Musk even said that he had Africa in mind when he developed this new home energy source.

  • One lithium-ion battery Powerwall costs $3,000.
  • The 220 pound Powerwall uses solar energy or builds up reserve energy for later consumption.
  • Daily-cycling Powerwall provides 7 kilowatt-hour capacity, 70 times to 100 times the power of a typical laptop battery.
  • Up to nine Powerwalls can be used in one home at one time to combine the power capacity, up to 63 kilowatt-hour.

While the new battery could prove to be a superior to alternative solar power batteries that are currently in use, it still is a product that is priced out of the market. The average energy consumption in the United States is about 30 kilowatt-hour. One Powerwall would provide less than a third of that energy demand, where the remaining demand must come from another energy source or sources. The average energy utility bill in the U.S. is $107 a month. If a third of that bill is about $36 and is covered by the Powerwall, it would take over 7 years before the savings would cover the cost of the Powerwall. With so many factors up in the air (the $5 billion Gigafactory and expansion, future home energy prices, solar cost and energy demand, other energy sources), the Powerwall looks more like a dream of Elon Musk.
Water Price Increase Solution for California Drought

Adapted from Richard B. McKenzie’s My California Water Is an Undiluted Bargain in the Wall Street Journal:

A neighborhood in the epicenter of rain-deprived Southern California pays only $0.002 per gallon for water. Other Californians pay up to three to four times more, but that’s still less than a penny per gallon.

While the obvious effect of extremely low prices is to encourage people to use more water, the less obvious effect is to discourage people from incurring even modest costs to curb water use.

At current water prices, many water-saving methods do not make economic sense in many areas of the state:

  • Dual-flush mechanisms can be installed in existing toilets and cost $20 to $40 each ― a median cost of $90 for three mechanisms. Assuming five “half-flushes” per person a day, at current price, the water bill saving for a family of two would be $12.41 a year. It would take more than seven years to recover mechanisms’ cost.
  • New, water-saving toilets use 1.28 gallons per flush instead of 3.5 gallons. Three high-quality water-saving toilets cost $2,254 installed. The saving on annual water bill would be $16.21. It would take more than 138 years to recover the cost of the new toilets, not including interest costs.

If the price of tap water were raised to the price of water sold by the gallon at the local Costco, then cost of the three toilets could be recovered through lower water bills in a little more than five months. That 325-fold price increase might be politically unacceptable. However, if the price of water were raised to just a nickel a gallon, many homeowners may adopt the new water-saving toilets.

Take a Train – Buses are too Complicated?

Apparently, when it comes to making a mass transit choice between trains and buses when travelling around town, people should pick the train.

From the Congress for the New Urbanism blog:

Why Buses Are Inferior

Critics of rail often argue that buses are superior; they are cheaper, more flexible and (sometimes) run almost as fast.  But in a recent blog post, Houston planning student Maggie Colson explains why trains are better than buses, even if the train isn’t much faster:

The train system was much easier to maneuver than the bus system. I found the bus system to be more complicated because you had to find the correct bus stop with the bus number labeled on it. In addition, you could easily end up going in the wrong direction – the buses did not have the directions labeled like the trains. On the bus you also had to know where you needed to get off. Unlike the train system, the bus did not stop at every stop and instead you had to push a button to request for the bus to stop. While this is not necessarily an issue once you know the route, trying to navigate for the first time was stressful. Without the use of my smartphone, I would not have found or gotten off at the correct bus stops.

In other words, with buses you really have to know what you are doing.

Ignoring the recent rail disaster in London, are buses inferior to rail?

The Expensive Solar Power Death Trap

The $2.2 billion Ivanpah Solar Electric Generating System is a concentrated solar thermal plant in the California Mojave Desert. The Ivanpah solar facility generates 377-392 megawatts (enough to power 140,000 homes) and spreads across 3,600 acres killed over 3,500 birds in its first year, according to a new report.

From 29 October 2013 to 20 October 2014 at the Ivanpah Solar Electric Generating System facility:

  • Avian detections at the site included 83 different bird species with 64 having fewer than 10 detections.
  • Of the remaining 19 species, all have populations that are great enough locally (either as breeders, wintering birds, or migrants), regionally, and nationally that the magnitude of mortality detected and/or estimated at Ivanpah during the first four seasons of monitoring would have a minimal impact on populations at any of these geographic scales.
  • The cause of death for 42.2 percent of the detections of species with 10 or more detections was unknown and thus cannot be determined with certainty to have been “facility-caused”, the standard cited in Section 5.3 of the Plan.

The report‘s recommendations concerning monitoring and/or adaptive management at Ivanpah include:

  • Continuation of Plan implementation as it was performed during year 1 monitoring.
  • Continue with and increase the number of searcher efficiency and carcass persistence trials to enable more refined estimates by season and/or within project elements.
  • Continuation of the adaptive management process to investigate means of reducing avian mortality.
  • Full implementation of bat deterrence at all three solar units.

In comparison, a new coal-fired power plant that generates enough electricity to power as many homes as Ivanpah, costs $1.1 billion. At double the cost, solar power is still too expensive.

Local Support for Keystone XL, Despite Political Affiliation

The Keystone XL Pipeline continues to remain in a locked up battle mainly between political parties. However, a recent study suggests that while politics prevents the pipeline from completion, local support shows a different picture. Those that live close to the proposed pipeline route are in favor of the project despite their political party affiliation. A possible reason for this is the greater media attention in localized areas that focus on jobs and economic benefits.

TransCanada has run into a new problem while working on alternative to the Keystone XL pipeline. Native groups in Canada are blocking most development in their territory, at least without consent and benefits directly to those nations. Until they are on board with developments like the proposed pipeline to the Pacific coast, these local groups will stall an alternative to the Keystone XL.


The Obsolete Crude Oil Export Ban

In the 1970s, during the Arab oil embargo, gasoline prices soared in the United States. Shortages created long lines of cars at the few gas stations that had fuel. In response, the U.S. began a series of policies that focused on its limited supply and high demand for oil. Policies included efforts to build up the oil reserves, reduction of oil imports and stabilization of the fuel prices. However, by the 1980s and 90s, oil imports to the U.S. were the highest ever and gas prices remained very volatile.

One particular policy was the Energy Policy and Conservation Act by President Ford in 1975. The act established a Strategic Petroleum Reserve, supporting an emergency storage of oil up to 727 million barrels and would last close to 160 days at a maximum withdrawal of 4.4 million barrels a day. The act also permitted the President to restrict exports of energy resources, such as crude oil:

Permits the President to restrict exports of coal, petroleum products, natural gas, or petrochemical feedstocks, and supplies of materials or equipment for exploration, production, refining, or transportation of energy supplies. Authorizes the President to exempt crude oil and natural gas exports from such restriction where he deems such exemption to be in the national interest, such as in recognition of the historic trading relations with Mexico and Canada.

The recent hydraulic fracturing boom, along with the discovery of vast amounts of oil deposits, has changed our domestic energy situation. For the first time since the 1960s, the United States is close to becoming energy independent. Therefore, many of the current policies of the 1970s are now obsolete.

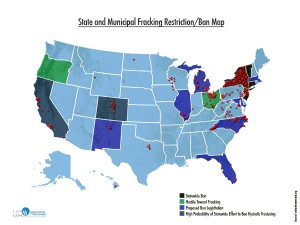
NCPA Hydaulic Fracturing Current and Proposed Restriction/Ban Map

FrackingMapForWeb

The National Center for Policy Analysis created a national hydraulic fracturing ban and restriction map that shows all of the recent local and state bans, proposed bans and restrictions.

By enacting this these bans, states are forgoing much needed revenue from the production of critical energy resources. The following are some of the states that are forgoing revenue due to current hydraulic fracturing bans:

  • California
$1,034,471,000
  • Colorado
$11,836,700
  • Connecticut
$131,200
  • Delaware
$96,178,800

U.S. Energy Infrastructure Still Lacking

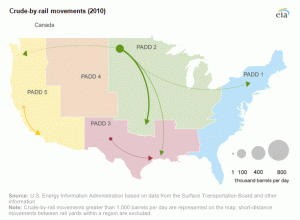
Energy booms, whether from oil or gas, will continue as both technology develops and more resources are discovered. However, each energy boom puts a strain on our existing energy infrastructure. For instance, oil can be transported by truck, ship, rail and pipeline. Pipeline is the safest and most reliable way to transport oil. Even with 185,000 miles of liquid petroleum pipeline across the United States, there is just not enough to transport the huge volume in the current boom. The lack of pipeline has increased transportation by rail and rail accidents during this time.oil_by_rail

  • The recent increase in transportation of oil by rail has increased the number of rail accidents.
  • In 2014, 70 percent of petroleum products and crude oil were shipped by pipeline, while 3 percent was shipped by rail.
  • A recent study by Fraser affirms their safety by reporting transporting oil by pipeline is 30 times less harmful than by train.

More and more oil is extracted every day and our storage capacity is overflowing. Two things need to happen that will greatly alleviate this situation. First, more pipelines are needed to transport all of this new oil. Second, all of this oil needs a place to go. Building more storage capacity only temporarily alleviates the problem. The crude oil export ban needs to be lifted so that the oil can get out of the over capacity storage units and enter the energy market.

National Ambient Air Quality Standards for Ozone response

Submitted comments to the Environmental Protection Agency on National Ambient Air Quality Standards for Ozone.

The Case for Lifting the Crude Oil Export Ban

The United States is running out of room in its crude oil storage facilities and the question is ― where does the crude go now? As domestic crude oil production continues to rise, it has no place to go due to an obsolete ban on the exportation of crude oil in the U.S.

The International Energy Agency said in its monthly oil market report that U.S. supply shows no signs of slowing down, an assessment that pushed the price of crude below $57 a barrel and lowered gas prices at the pump. Low gas prices led to record amounts of driving in 2014, culminating in a record-breaking December, new federal data shows.

With the U.S. now producing more oil and natural gas than Russian and Saudi Arabia, over 11 million barrels a day (55 percent increase from five years ago), lifting the U.S. oil export ban would:

  • Add over $1 trillion in government revenues by 2030.
  • Create 300,000 more jobs a year.
  • Increase current U.S. production from 8.2 million B/D currently to 11.2 million B/D.
  • Cut the U.S. oil import bill by an average of $67 billion per year.
  • Lower gasoline prices by an annual average of 8 cents per gallon.
  • Save U.S. motorists $265 billion for during the 2016-2030 period.

Despite the fact that oil imports are at the lowest level since 1985, the U.S. still imports 33 percent of its oil from foreign sources. A broad view by the public is that U.S. oil should stay at home will test export proponents. A majority of voters, 53 percent, opposed exporting oil. At present, the current policy is discouraging additional crude oil supplies from being brought to market, which actually makes gasoline prices higher than they otherwise would be. The increased economic activity resulting from the rise in crude production would support an average of 394,000 additional U.S. jobs over the 2016-2030 period, with a peak of 964,000 jobs in 2018.

Doing away with exports restrictions would also generate added benefits to U.S. household income, gross domestic product (GDP) and government revenues. The average disposable income per household would increase by an additional $391 in 2018 as benefits from increased investment.

The current hydraulic fracturing and American energy boom is reducing oil imports by 22 percent next year. Lifting the crude oil export ban would increase the energy boom. This boom could also reduce the oil imports of European countries. The United States could replace Russia title as “Europe’s gas station” and provide all of Europe’s energy needs.