Category: Land Issues

Offshore Access Critical to U.S. Energy Security

The Department of the Interior granted conditional approval to a plan by Shell Gulf of Mexico to begin exploratory drilling in the Chukchi Sea in the Arctic Ocean. Federally owned offshore oil and natural gas reserves of the United States are estimated to hold over 50 billion barrels of crude oil 200 trillion cubic feet of natural gas. However, close to 87 percent of federal offshore acreage is off limits to energy exploration and development. Without energy exploration to give a more accurate estimation of energy reserves, the closed off area could hold far more oil and natural gas reserves.

The Bureau of Ocean Energy Management’s offshore oil and natural gas leasing plan for 2017-2022 excludes promising areas in the Atlantic, Pacific, and Arctic and in the Gulf of Mexico.

Expanding offshore access would:

  • Create nearly 840,000 new American jobs.
  • Increase oil production by 3.5 million barrels per day.
  • Generate $200 billion cumulative revenue for the U.S. government.
  • Add $450 billion in private sector spending.
  • Add $70 billion per year to the U.S. economy.

The United States is now producing the most oil in the world and can continue to do so if more pro-energy policies, such as opening all federally owned offshore areas, are adopted by the federal government.

Federal Land Regulation Continues to Strangle Energy Production…

Federal land ownership in the United States continues to grow despite the federal government already owning more than half of most of the western states. While some have been advocating for the return of this land to the states or protect it from being closed off from oil and gas operations, the Obama Administration has worked just as hard to increase the federal government’s land grab. Contrast:  As President Bush’s second term as president was coming to an end, 4 million acres of land in Alaska was released by the Bureau of Land Management (BLM) for drilling and exploration. Seven years later, President Obama has proposed to set aside 12 million acres in Alaska, designating it as “wilderness” and off-limits to up to 42 billion barrels of oil.

Most recently, the Obama administration has proposed the largest critical habitat designation ever, setting aside 226 million acres of ocean off Alaska’s coastline (an area twice the size of California) to protect the Arctic ringed seals who were listed as “threatened” under the Endangered Species Act in 2012 after environmental activists petitioned the Obama administration.

Even though NOAA says that oil and gas activities have occurred in areas with protected species in the past, designating these Alaskan waters as a critical habitat would mean that all oil and gas activity would have to be evaluated based on how much it would impact ringed seals. Alaska’s outer continental shelf is considered to be one of the world’s largest untapped oil and gas reserves boasting as much as 27 billion barrels of oil and 132 trillion cubic feet of natural gas.

Other federal lands expansion that slipped into the National Defense Authorization Act (NDAA) would add 250,000 acres of new wilderness in western states and put thousands more acres off limits to drilling and mining in states.

In 2011, the U.S. Forest Service originally tried to ban fracking in the 1 million acre George Washington National Forest, but failed. It would have been the first outright ban on the practice in a national forest.

Much of the land targeted for government takeover holds great oil and natural gas resources which could provide jobs in the energy industry and a flow of resources from our own American supply. Once those lands become “monuments,” access to those natural resources is limited and in the hands of the federal government. The government currently owns 650 million acres, or 29 percent of the nation’s total land.

The Omnibus Public Land Management Act of 2009 and the Northern Rockies Ecosystem Protection Act (NREPA). The Omnibus bill was passed with over 100 land grab measures. The NREPA included federal takeover of nearly 24 million acres of land in the American west and northwest; however, NREPA never made it out of the House subcommittee.

The ability of the White House to simply snatch land from under the feet of the American people comes from the Antiquities Act of 1906. The Act was initially intended to set aside small portions of land for monuments and national parks, but has since been abused by lawmakers to control large quantities of property. Federal government land control and land acquisition takes away opportunities for development, particularly when it comes to much needed energy resources. The land designated as “monument” space could have created jobs, boosted the economy and enhanced our energy security.

Sand Dune Lizard and Lesser Prairie Chicken Could Halt Industry

The plight of two species is putting thousands of acres and the future of the oil and gas industries at risk. If put on the endangered species list, the sand dune lizard and the lesser prairie chicken could block off land from oil and gas companies across multiple states.

The lesser prairie chicken was added to the threatened species list after a court ruling in March 2014. The chicken has known habitats in Colorado, Kansas, Oklahoma, Texas and New Mexico, and land management decisions could impact over 100 million acres across the five states.

The sand dune lizard is posing particular problems for the oil industry in West Texas. The lizard’s 800,000 acre habitat spans Southeastern New Mexico and West Texas and just happens to sit right in the middle of Texas oil country.

Given the Obama administration’s recent demonstrations of its willingness to put potentially beneficial land under federal protection, many in the oil and gas industries are concerned that even the potential presence of these species could shut down oil and gas rich areas from exploration or further development.

Shutting down oil-rich areas to protect these species isn’t just bad for the oil and gas industry ― it’s bad for its employees as well. Texas state officials and energy executives have warned that classifying the sand dune lizard as an endangered species could cost thousands of Texans their jobs.

Obama Starts Tug-Of-War over 12 Million Acres

The Obama administration’s proposal to expand federally protected lands in Alaska has sparked huge controversy with the state’s entire government.

Alaska’s Arctic National Wildlife Refuge (ANWR) currently protects about seven million acres from oil and gas exploration. Obama’s new proposal would close off another 12.28 million acres. Closing off this land “is a stunning attack on our sovereignty and our ability to develop a strong economy,” said Senate Energy and Natural Resources Committee Chairwoman Lisa Murkowski, a Republican from Alaska:

It’s clear this administration does not care about us, and sees us as nothing but a territory. The promises made to us at statehood, and since then, mean absolutely nothing to them. I cannot understand why this administration is willing to negotiate with Iran, but not Alaska. But we will not be run over like this. We will fight back with every resource at our disposal.

Alaska’s Governor Bill Walker also expressed displeasure with the proposal, and is considering increasing oil development on state-owned lands in response to the proposal:

Having just given to Alaskans the State of the State and State of the Budget addresses, it’s clear that our fiscal challenges in both the short and long term would benefit significantly from increased oil production. This action by the federal government is a major setback toward reaching that goal. Therefore, I will consider accelerating the options available to us to increase oil exploration and production on state-owned lands.

The Obama administration says that Murkowski’s reaction to the announcement was “unwarranted.” However, this is not the first time Alaska and the Obama administration have butted heads. In 2013, Secretary of the Interior Sally Jewell rejected the construction of a gravel emergency road across Izembek National Wildlife Refuge, to the ire of Alaska lawmakers.

While the proposal requires congressional approval, the Interior can still create extra protections on the region. This proposal is already being heralded as one more example of the Obama administration’s federal overreach, and could continue to incite major discontent from Alaskan legislators.


Looking Under the Crust ― Seismic Activity, Fracking and Graphs

Texas has always been a battleground between skeptics and environmentalists, but a developing trend of seismic activity has also turned it into a promising research laboratory for scientists and seismologists.

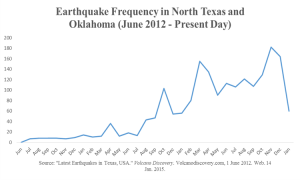
Volcano Discovery, a group of scientists dedicated towards the global study of volcanoes and earthquakes alike published the following figures which the NCPA has reformatted without tampering or omissions of data:

quake freqency texas

Important disclaimers include:

  • the final apparent drop in seismic activity, which may simply be due to the fact that we are only halfway into January
  • an omission of point for November in 2013, for which there was no data
  • However, the most important fact uncovered, is that though this chart measured the frequency of the earthquakes, further analysis of data collection methods, times and earthquake locations has led us to believe that there is significant double-counting occurring in this data… Meaning that two or three different cities may have noted the same tremor, yet the data was recorded as multiple bouts of seismic activity.

Regardless of this skew, and the likelihood for overstatement in this data, it is difficult to refute the clear trend in this chart. Indeed, the Dallas Morning News states,

There is evidence that some central and eastern North America earthquakes have been triggered or caused by human activities that have altered the stress conditions in earth’s crust sufficiently to induce faulting.

According to the Dallas Morning News, these activities include what you would expect,

… impoundment of water behind dams, injection of fluid into the earth’s crust, extraction of fluid or gas, and removal of rock in mining or quarrying operations…

But even if these tremors are truly increasing in frequency due to fracking and fuel extraction, is it really a threat to Texas’ lives and infrastructure? There is no recent record of significant damage due to tremors in Oklahoma or Texas, what’s more many of these tremors are occurring in areas where the population density can be as low as five people per square mile… denoting a very rural or sparse suburban setting.

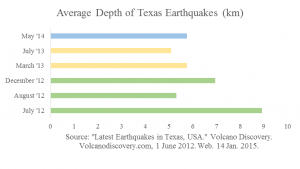
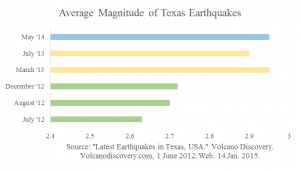
Six months of data from Volcano Discovery’s records were randomly selected and analyzed for changes in magnitude and depth of Texas earthquakes:

magnitude texas quakes

depth of texas quakes

Depth has decreased and magnitude has increased, however in assessing these results, we always must prioritize one of the most basic rules of statistics: Correlation is not causation. What’s more, a larger sample of months can give more definitive results. There is still much research to be done on the origin of these earthquakes, and not enough risk to human life and private/public capital given what we know, at least not enough to make drastic decisions set forth by some environmental groups.

Move Over Spotted Owl, Make Room for the Sage Grouse

The federal government is aggressively protecting the sage grouse. A few weeks ago, the Feds listed the Gunnison sage grouse as “threatened” under the Endangered Species Act. The Feds want to add the greater sage grouse to the list. The greater sage grouse:

  • lives in 11 western U.S. states
  • covers 165 million acres, almost as big as Texas
  • population dropped from around 16 million over 200 years ago, to under half-million today

Conservationists believe that the sage grouse numbers are getting dangerously low. Human activity, specifically energy exploration and development, is the main cause of this issue, they claim.

However, local efforts in conservation and local economies are overlooked when considering listing under the Endangered Species Act in these cases. Overzealous efforts could have irreversible consequences to local economies and hinder growth. Much of the land in western United States is owned by the federal government. Imagine if that same amount of land in the eastern U.S. was also owned by the Feds. More than likely, the United States would not be the global leader that it is today.

Suburban Nation: U.S. 86 Percent Suburban

From Jurisdictional to Functional Analysis of Urban Cores & Suburbs

For decades there has been considerable analysis of urban core versus suburban trends. However, for the most part, analysts have been jurisdictional, comparing historical core municipalities to the expanse that constitutes the rest of the metropolitan area. Most core municipalities are themselves substantially suburban, which can mask (and exaggerate) the size of urban cores and understate the extent of suburbanization.

Our new City Sector Model evaluates the more than 8,900 zip codes in the 52 U.S. metropolitan areas that have more than 1,000,000 residents (“major metropolitan areas”) based on travel behavior and urban form. There are four categories, including  (1) Pre-Auto Urban Core, (2) Auto Suburban: Earlier, (3) Auto Suburban: Later and (4) Auto Exurban. It is recognized that automobile oriented suburbanization was underway before World War II, but it was interrupted by the Great Depression during the 1930s and was small compared to the democratization of personal mobility and home ownership that has occurred since that time.

Canada: A Suburban Nation

The City Sector Model is broadly similar to the groundbreaking research published by David L. A. Gordon and Mark Janzen at Queen’s University in Kingston Ontario (Suburban Nation: Estimating the Size of Canada’s Suburban Population) on the metropolitan areas of Canada. Gordon and Janzen concluded that the metropolitan areas of Canada are largely suburban. Among the major metropolitan areas of Canada, the Auto Suburbs and Exurbs combined contain 76 percent of the population, somewhat less than the 86 percent in the United States.

All U.S. Major Metropolitan Area Growth Has Been Suburban and Exurban

Virtually all population growth in U.S. metropolitan areas (as currently defined) has been suburban or exurban since before World War II (the 1940 census). The historical core municipalities that have not annexed materially and were largely developed by 1940 have lost population. Approximately 110 percent of their metropolitan area growth has occurred in suburbs and exurbs. Further, among the other core municipalities, virtually all of the population growth that has occurred in annexed areas or greenfield areas since 1940.

Identifying the Pre-Auto Urban Core

Not being constrained by municipal boundaries is important because core municipalities vary substantially. For example, the core municipality represents less than 10 percent of the population of Atlanta, while the core municipality represents more than 60 percent of the population of San Antonio. The City Sector Model applies data available from the U.S. Census Bureau to estimate the population and distribution of Pre-Auto Urban Cores in a consistent manner.

At the same time, the functional analysis is materially different from the Office of Management and Budget (OMB) classification of “principal cities.” It also differs from the Brookings Institution “primary cities,” which is based on the OMB approach. The OMB based classifications classify municipalities using employment data, without regard to urban form, density or other variables that are associated with the urban core. These classifications are useful and acknowledge that the monocentric nature of US metropolitan areas has evolved to polycentricity. However, non-urban core principal cities and primary cities are themselves, with few exceptions, functionally suburban (some of the most significant examples are Mesa, Arizona in the Phoenix area, which had a population of only 7,000 in 1940 and Arlington, Texas, in the Dallas-Fort Worth area, which had a population of only 4,000. Their populations, now both 350,000 or more are virtually all automobile oriented suburban).

The City Sector Model Criteria

Because of the substantial interest of urban planners in minimizing the use of automobiles and restoring transit, walking and cycling as primary urban travel alternatives, it is important to identify the extent of automobile oriented suburbanization to the greatest extent possible. Better information is required, regardless of an analysts’ orientation. (As an aside, this author believes that the data shows planning efforts to lead to lower standards of living and greater poverty, which is discussed in Toward More Prosperous Cities).

A number of data combinations were tested for the Pre-Auto Urban Core, to replicate as closely as feasible the 2010 population of the core municipalities that have virtually the same boundaries as in 1940 and that were virtually fully developed by that time (the Pre-War & Non-Suburban classification in historical core municipalities). The following criteria were accepted (represented graphically).

  •  The Auto Exurban category includes any area outside a principal urban area.
  •  The Pre-Auto Urban Core category includes any non-exurban with a median house construction date of 1945 or before and also included areas with a population density of 7,500 per square mile (2,900) or more and with a transit, walk and cycling journey to work market share of 20 percent or more.
  •  The Auto Suburban Earlier category included the balance of areas with a median house construction date of 1979 or before.
  •  The Auto Suburban Later category later included the balance of areas with a median house construction date of 1980 or later.

Additional details on the criteria are in the Note.

Results: 2010 Census

 The combined Pre-Auto Urban Core areas represented 14.4 percent of the population of the major metropolitan areas in 2010 (2013 geographical definition). This compares to the 26.4 percent that the core municipalities themselves represented of the metropolitan areas, indicating their large functionally suburban components.

The Auto Suburban: Earlier areas accounted for 42.0 percent of the population, while the Auto Suburban: Later areas had 26.8 percent of the population. The Auto Exurban areas had 16.8 percent of the population.

The substantial difference between U.S. and Canadian urbanization is illustrated by applying an approximation of the Gordon-Janzen criteria, which yielded an 8.4 percent Pre-Auto Urban Core population. The corresponding figure for the six major metropolitan areas of Canada was 24.0 percent. This difference is not surprising, since major Canadian urban areas have generally higher densities and much more robust transit, walking and cycling market shares. Yet, the Gordon-Janzen research shows Canada to be overwhelmingly suburban.

Population Density: As would be expected, the Pre-Auto Urban Core areas had the highest densities, at 11,000 per square mile (4,250 per square kilometer). The Auto Suburban: Earlier areas had a density of 2,500 per square mile (1,000 per square kilometer), while the Auto Suburban: Later had a population density of 1,300 per square mile (500 per square kilometer), while the Auto Exurban areas had a population density of 150 per square mile (60 per square kilometer).

Individual Metropolitan Areas (Cities)

The metropolitan areas with the highest proportion of Pre-Auto Urban Core population are New York (more than 50 percent), and Boston (nearly 35 percent), followed by Buffalo, Chicago, San Francisco-Oakland and Providence, all with more than 25 percent.

It may be surprising that many of the major metropolitan areas are shown with little or no Pre-Auto Urban Core population. For example, five metropolitan areas have no Pre-Auto Urban Core population, including Phoenix, Riverside-San Bernardino, Tampa-St. Petersburg, Orlando, Jacksonville and Birmingham. By the Census Bureau criteria of 1940, two of these areas were not yet metropolitan and only Birmingham (400,000) had more than 250,000 residents. Only the larger metropolitan had strong Pre-Auto Urban Cores. Many of the newer and fastest growing metropolitan areas were too small, too sparsely settled or insufficiently dense to have had strong urban cores before the great automobile suburbanization that followed World War II. Further, many of the Pre-Auto Urban Cores have experienced significant population loss and some of their neighborhoods have become more suburban (automobile oriented). Virtually no urban cores have been developed since World War II meeting the criteria.

Thus, no part of Phoenix, San Jose, Charlotte and a host of other newer metropolitan areas functionally resembles the Pre-Auto Urban Core areas of metropolitan areas like Chicago, Cincinnati or Milwaukee. However, new or expanded urban cores are possible, if built at high enough population density and with high enough transit, walking and cycling use.

Despite the comparatively small share of the modern metropolitan area represented by the Pre-Auto Urban Core in the City Core Model, the definition is broad and, if anything over-estimates the size of urban core city sectors. The population density of Pre-Auto Urban Core areas is below that of the historical core municipalities before the great auto oriented urbanization (11,000 compared to 12,100 in 1940) and well above their 2010 density (8,400), even when New York is excluded. The minimum density requirement of 7,500 per square mile (not applied to analysis zones with a median house construction data of 1945 or earlier) is slightly less than the density of Paris suburbs (7,800 per square mile or 3,000 per square kilometer) and only 20 percent more dense than the jurisdictional suburbs of Los Angeles (6,400 per square mile or 2,500 per square kilometer). Some urban containment plans require higher minimum densities, not only in urban cores but also in the suburbs.

The United States: An Even More Suburban Nation

In describing the Canadian results, Professor Gordon noted that there is a tendency to “overestimate the importance of the highly visible downtown cores and underestimate the vast growth happening in the suburban edges.” That is true to an even greater degree in the United States.

—–

Note: The City Sector Model is applied to the 52 major metropolitan areas in the United States (over 1 million population). The metropolitan areas are divided into the principal urban areas, with areas outside categorized as exurban. The principal urban areas in Los Angeles and San Francisco encompass the smaller Mission Viejo and Concord urban areas, which are adjacent. As a result, some smaller urban areas, such as Palm Springs (Riverside-San Bernardino metropolitan area), Lancaster (Los Angeles metropolitan area) and Poughkeepsie (New York metropolitan area) are considered exurban. Areas with less than 250 residents per square mile (100 per square kilometer) are also considered exurban, principally for classification of large areas on the urban fringe that have a substantial rural element.

The Pre-Auto Urban Core includes all non -– exurban areas in which is the house construction date is 1945 or before. In addition, the urban core includes areas that have a population density of 7,500 per square mile (2,900 per square kilometer) or more and a transit, walking and cycling journey to work market share of 20 percent or more, so long as they are in the urban area.

The analysis zones (zip codes) have an average population of 19,000, with from as many as 1,000 zones in New York to 50 in Raleigh.

—–

This article is adapted from From Jurisdictional to Functional Analysis of Urban Cores and Suburbs, originally published in newgeography.com. That article contains charts, tables and representative maps.
Smart Growth: Destroying Housing Opportunity from California to Australia (and Beyond)

Two recent stories provide further  evidence on the extent to which urban containment policies (also called smart growth, growth management, compact city policy, livability and urban consolidation) raises house prices relative to incomes, thereby reducing housing affordability. Because housing represents the largest element of household budgets (not transportation as a US government website implies), urban containment policy reduces discretionary income — the money households have left over after taxes and paying for necessities. This leads to a lower standard of living and more poverty, and violates the fundamental purposes of urban planning, described by former World Bank principal planner Alain Bertaud as:

“Increasing mobility and affordability are the two main objectives of urban planning. These two objectives are directly related to the overall goal of maximizing the size of a city’s labor market, and therefore, its economic prosperity.”

Two recent stories describe the effects of urban containment policy on the standard of living:

The Economist and Urban Containment “Fat Cats”

“Free Exchange” in The Economist came  down strongly on the side of economics in a review of housing affordability.

According to The Economist, the unusually high cost of housing in San Francisco (and other places) is principally the result of tight land use regulation, which makes it expensive or impossible to build. If “local regulations did not do much to discourage creation of new housing supply, then the market for San Francisco would be pretty competitive.” Add to that Vancouver, Sydney, Melbourne, Toronto, Portland and a host of additional metropolitan areas, where urban containment policy has driven house prices well above the 3.0 median multiple indicated by historic market fundamentals.

The Economist explains the issue in greater detail: “We therefore get highly restrictive building regulations. Tight supply limits mean that the gap between the marginal cost of a unit of San Francisco and the value to the marginal resident of San Francisco (and the market price of the unit) is enormous. That difference is pocketed by the rent-seeking NIMBYs of San Francisco. However altruistic they perceive their mission to be, the result is similar to what you’d get if fat cat industrialists lobbied the government to drive their competition out of business.” (Our emphasis).

Of course urban planning interests have long denied that that rationing land is associated with higher housing prices (read greater poverty and a lower standard of living). Nonetheless urban containment policies not only drive up the price of land, but do so even as they reduce the amount of land used for each new residence, driving prices per square foot of land up as well.

The Economist notes that unless the direction is changed, housing policy will continue to be “an instrument of oligarchy. Who knows. But however one imagines this playing out, we should be clear about what is happening, and what its effects have been.”

Land Prices Skyrocket as Residential Lot Sizes Fall in Australia

The extent to which smart growth policy (urban continament policy or urban consolidation policy) is associated with higher land (and house) prices is illustrated by a recent press release from RP Data in Australia. The analysis examined the vacant building lot prices for the period of 1993 to 2013.

During the period, the median price of a vacant lot rose 168 percent after adjustment for inflation.This is nearly 5 times the increase in the median household incomes of the seven largest capital cities (Sydney, Melbourne, Brisbane, Perth, Adelaide, Canberra and Sydney).

But it gets worse. The median lot size was reduced nearly 30 percent. This should put paid to the myth that urban containment reduces lot prices as it reduces their sizes. The same dynamic has been indicated in the United States.

Australia has been plagued by huge house cost increases relative to incomes in association with urban containment policy. Before the adoption of urban containment policy, it was typical for house prices to average three times or less than that of household income. Now, Sydney has the highest median multiple (median house price divided by median household income) of any major metropolitan area in the New World, with the exceptions of Vancouver and San Francisco. Melbourne, the second largest metropolitan area in Australia, has a median multiple of 8.4, making it fifth most costly in the New World, behind San Jose. All of Australia’s major metropolitan areas are “severely unaffordable,” including slow-growing Adelaide (6.3), as well as most smaller areas.

Getting Priorities Right

Research on these impacts led London School of Economics professor Paul Cheshire to conclude that urban containment policy is irreconcilable with housing affordability. This means that urban containment policy is irreconcilable with a better economic future for households, including those in poverty.

The purposes of urban containment policy are largely driven by a particular vision of the urban form and a manifestly wrongheaded belief that rationing land and limiting mobility can contribute materially to reducing greenhouse gas emissions. The issue is neither urban design nor the expensive and ineffective strategies of urban containment. People are more important — their standard of living and reducing the number living in poverty. There is a compelling need to reorient urban policy in this direction (see Toward More Prosperous Cities).

—–

For a complete listing of median multiples by major metropolitan area, see the 10th Annual Demographia International Housing Affordability Survey.

Additional information on the RP Data research is available at Australian Property Through Foreign Eyes

—–

Note: This article is adapted from contributions by the author to the newgeography.com

A Way Out of The Endangered Species Mess

Too many environmental issues are seen as crime and punishment problems.  The bureaucratic process that implements the Endangered Species Act (ESA) is one of the results. That process produces too few environmental benefits, too many economic losses, and an unnecessary infringement on individual liberties. Far more species go extinct waiting to be listed as endangered or threatened, and after being listed, than are upgraded to a less threatened status or delisted (true success).

The current process is unsuited to the real issue, which is how to efficiently accommodate competing users (people, plants, and animals) of land. That is being increasingly recognized, even by mainstream environmental activists. With the implementation details of each case now in the hands of government employees, the science of species listing and recovery is tainted by politics. Since the ESA’s official goal of preserving our biodiversity enjoys strong public support, we must develop news, more productive ways of pursuing it.

With appropriate property rights, market mechanisms will protect threatened plants and animals much more efficiently than the current bureaucratic process. Private property rights can be strengthened to make listed plants and animals more valuable to individual landowners (50% of endangered and threatened species occur only on private land) as they become more scarce. It will cause landowners (including public landowners) to ‘set aside’ enough land to recover and sustain each listed species. The key details are the definition of habitat, how much is enough, and how much actual and restorable habitat exists; facts that are already required by the existing process.

‘Set aside’ should not mean outright purchase in most cases. Most species can co-exist with human activity. Indeed, they must. There is not enough money or land to provide every threatened species with its own exclusive refuge. The viable terms of that co-existence determine the type of easement that landowners that eliminate habitat must purchase (perhaps subsidized?) from landowners that maintain habitat. The market price of such easement arrangements will depend upon development pressures (demand), the scarcity of existing and potential habitat, and the biological requirements of the species (supply).

In the well-known, expensive Edwards Aquifer-Endangered Species situation of South Central Texas, pumpers could be habitat eliminators during severe droughts. An approach analogous to land easements would be to levy a small pumping fee and use the revenue to maintain aquatic habitat. Depending on cost comparisons and conditions, a number of measures could be funded. They include springflow purchase, springflow augmentation, and artificial habitat maintenance for the inevitable times of severe drought. Past attempts (the 1995 Texas Legislature’s revision of 1993’s SB 1477) to address the problem are very expensive, they limit pumping too much, they do not ensure that the springs the endangered species depend on will not go dry, and therefore do not ultimately fully address the possibility of federal sanctions that supposedly justify the costly measures.

All landowners would be better off under the proposed easement purchase process than under the expensive, open-ended, indeterminate process that exists now. Landowners contemplating land uses that would eliminate some habitat would enjoy lower known costs and no species habitat-related delays. The existing process is fraught with uncertain high costs and long delays, and often ultimate denial of permission. It is especially hard on small landowners, for whom the existing process can easily cost much more than their land is worth.

Under the easement purchase proposal outlined above, land developers would have an incentive to minimize their destruction of habitat, and other landowners would have an incentive to protect and restore habitat, and advertise its existence. Habitat owners would profit from the chance to sell the easements. Habitat owners would be better off under the proposed market approach than if there was no public interest in maintaining a sufficient level of species habitat. Contrast that with the existing incentives. Now most landowners fear (and take steps to prevent) the discovery of habitat of potentially threatened species on their property, because it could cause property values to fall, and land use restrictions could lead to forfeiture. Species also suffer from the existing process because it creates incentives to destroy habitat, and no incentive to maintain it.

In closing, it is important to summarize the role of government in the proposed market approach to species protection. The government would no longer engage in case-by-case ‘consultations’ (the root of the problem). Biological data would be used to define the terms of easements, and how much protected habitat is enough. The government would enforce compliance with the terms of the easements just like it enforces other contracts. If the requirement that habitat eliminators acquire easements constitutes a ‘taking’, public funds could be used to subsidize easement purchases.

Real Water Markets: Another Leadership Imperative

Political and economic freedom plus the rule of law and free enterprise yields the prosperity that we enjoy, and its absence explains why most of the world lags so far behind us. Its absence also explains why some sectors of our economy lag so far behind the rest. We use our resources more wisely than most of the rest of the world because market-determined prices guide most of our resource use decisions.

Changing market prices are a powerful information and incentive system. That system has an impressive track record because every price is the result of a serious, continuous, money-where-your-mouth-is indirect conversation about priorities and costs. It involves the entire population, so it harnesses much more information than the central planning alternative, which is just guesswork by a handful of over-extended public officials spending someone else’s money. Central planning has an awful track record, not just for economic inefficiency and poverty, but for creeping tyranny.

Market-determined prices will address Texas’ water management challenges more effectively than our current system of limited markets and central planning. Willing buyer — willing seller exchange of privately-owned water rights will tell us what each basin’s lowest value water uses are worth. Until we know what price existing users would sell water for, we cannot tell which potential water projects are wise investments. Price differences between water basins tell us if inter-basin transfers make economic sense, and tell us what restrictions on inter-basin transfers cost. The same price information is an essential element of water conservation planning.

Texas surface water law allows water rights’ exchanges, but transfers are over- regulated. For example, water rights holders cannot change water uses without state permission. Water rights are just revocable permission to use state water; a factor that undermines exchange, investment in water-related infrastructure, and promotes wasteful use-it-or-lose-it usage. Let’s hope for the wisdom and leadership to fix that before our drought and recent referendum push us to waste billions of dollars and the environmental disaster of unnecessarily flooding thousands of acres under new reservoirs.

Texas groundwater law has not even come that far. Many groundwater basins have long since reached the point where recharge can no longer keep up with unlimited pumping, which means that efficient use requires quantified pumping rights and a price system. Only the Edwards Aquifer area of South Central Texas has quantified pumping rights, but even there, water users cannot trade directly. Much of the Edwards Aquifer permitted pumping is locked into historic and mostly low water uses. Those are very expensive restrictions. How expensive? Only a system of market-determined prices can reveal the true amount.

The legal infrastructure needed to foster market-determined surface- and ground- water prices will have to incorporate numerous geologic, hydrologic, and historic use details that are beyond the scope of this commentary. But nothing about issues like third-party claims, drought management, and environmental values preclude the government from severely curtailing its costly micro-management of water use. Getting there is just a matter of leadership; selling the correct, limited government policies to a general public interested in freedom-based new ideas.