Tag: "human emissions"

Lies, Damn Lies and Statistics: The 2014 National Climate Assessment Report

The 2014 U.S. National Climate Assessment (NCA) report has been receiving much attention since President Obama heralded it in his speech back in May. The administration realizes that the push for ever greater climate change regulations requires convincing evidence of sufficient alarm to justify this authoritarian push. While this report delivers the alarm, it falls short on verifiable evidence. Indeed, a scientific rebuttal of many parts of the NCA report appears here.

However, an astute follower of our NCPA Energy and Environment blog, Tom Isaacson, has also reviewed the NCA report and has found it wanting. He points out that the evidence used in the report to verify the impact of mankind’s activity on global temperatures is badly misrepresented. And he uses the information cited in the NCA report as proof to back his claim. Page 8 of the NCA report contains this graphic:

global temp change

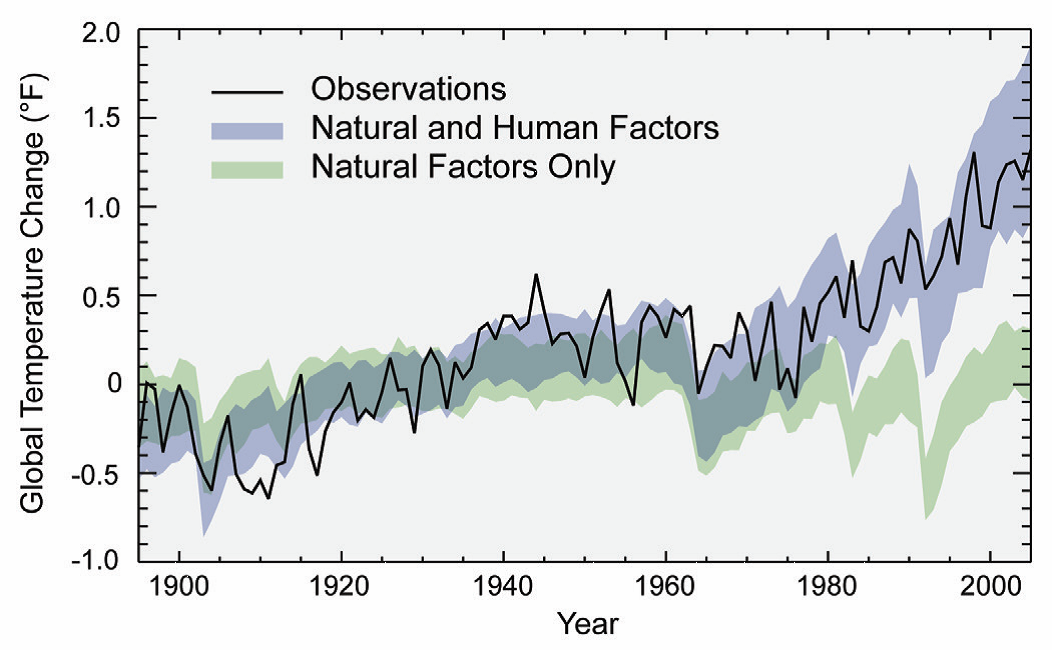
Isaacson points out that this graphic portrays two confidence bands produced by the accepted climate models to predict annual average global temperature changes over the years. The lower band (in green) represents the range of temperature changes that the models predict would have occurred naturally without any human factors. The upper band (in blue) represents the range of predicted temperature changes when both natural and human factors are combined. The solid black line indicates the actual observed temperature changes for each year, ending in 2005.

The NCA report notes that the annual temperature changes over the past half century have been almost entirely within the band of predicted changes arising from both human and natural impacts, but almost entirely outside the band of predicted changes arising from only natural impacts. This implies that not only are the accepted climate models accurate and trustworthy, but they also provide evidence supporting the conclusion that the actions of mankind are indeed responsible for global warming.

However, this is where Isaacson points out the “sleight of hand” used in the statistical analysis: the NCA analysis and graphic both use the wrong prediction bands to build credibility for the models and to support their conclusions. His proof: the NCA report bases their analysis and above graphic on an 2011 article written by Markus Huber and Reto Knutti (H&K) in the journal, Nature Geoscience. Their graphic appears below:

global temp change2

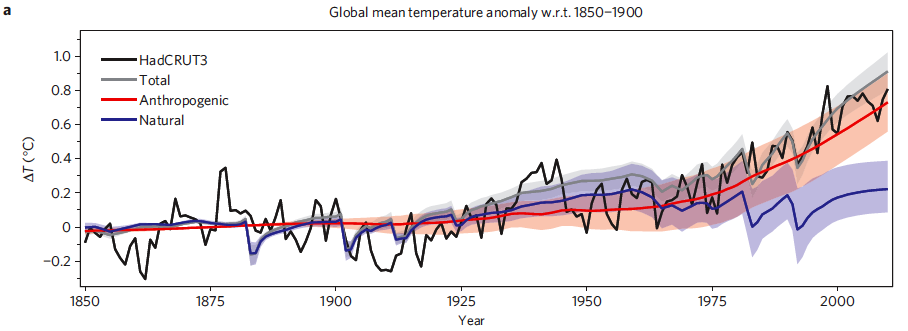
The lower prediction band (in blue) represents the predicted range of temperature changes that would have occurred naturally without any human factors. The middle band (in orange) represents the range of changes if only human factors are reflected. The upper band (in grey) represents the range of changes if both human and natural factors are combined. Now let us have a look up the sleeve of the NCA magicians…

Note how the grey prediction band from H&K graphic representing both human and natural factor impacts is narrower than the orange band representing only human factor impacts, which in turn is slightly narrower than the band representing natural factors alone. These relative band size relationships are clearly notretained in the NCA report graphic, which shows the prediction band for the combined human and natural factors as being much wider than for the natural factors alone.

In other words, it appears that the authors of the NCA report use an incorrect, wider confidence band to make the temperature predictions of the climate models to appear artificially accurate, thereby making the climate models appear to be more trustworthy. To illustrate, note that the spike in average global temperature change in 1998, and the dip in 2000, both fell completely outside the grey prediction band in the H&K chart, but fall completely inside the blue prediction band in the NCA report.

Further, Isaacson notes that the NCA report cuts off their chart in 2005, while the H&K chart continues on out to 2010. Indeed, the attenuated NCA chart fails to show that the low temperatures recorded in the H&K chart for 2007, 2008 and 2009 all lie below and outside the grey prediction band. This means that the model creates a prediction band that fails to include 5 of the last 12 years of the observed annual data — because the temperatures were lower than predicted.

I am sorry, but Tom and I both feel that being wrong 41 percent of the time over the last twelve years is certainly not a good enough track record to justify using these findings to impose many billions of dollars’ worth of climate change regulations onto a sputtering American economy.

Brazil’s Environmental Policy: A Model for the United States?

In a 2009 study conducted by the Public Library of Science on the evaluation of the relative environmental impact of countries, Brazil ranked 1st on a scale measuring absolute composite environmental rank. The study’s methodology used a lower rank to correlate with a higher negative impact. Thus, Brazil had the highest overall negative impact on its environment of any country. According to this study:

  • National Forest Lost Rank: 1st
  • Natural Habitat Conversion Rank: 3rd
  • Marine Captures Rank: 30th
  • Fertilizer Use Rank: 3rd
  • Water Pollution Rank: 8th
  • Threatened Species Rank: 4th
  • Carbon Emissions Rank: 4th
  • Absolute Composite Environmental Rank = 4.5 (1st)

While these numbers appear bleak for the country that just hosted the World Cup and the Olympics in two years, Brazil, according to the Economist, has become the world leader in reducing environmental degradation in recent years.

In the 1990s, Brazil felled rainforest the size of Belgium annually. However, in the past decade, Brazil has reduced deforestation by nearly 70 percent in the Amazonian jungle. If deforestation had continued at its 2005 rate of 19,500 km2 per year, an extra 3.2 billion tons of carbon dioxide would have been emitted. Thus, Brazil could also be viewed as a pioneer for climate change mitigation. Unlike other countries, such as Indonesia and the Democratic Republic of the Congo, Brazil has been able to slow and stop these clearances. The reason for its success has been a result of incremental efforts in three stages.

  • Stage 1 (mid-1990s – 2004): The Brazilian government implemented its first bans and restrictions, one of which stated that on every farm in the Amazon, 80 percent of the land had to be set aside as a forest reserve. However, this was the worst period of deforestation because the share was so high that farmers could not comply with the code.
  • Stage 2 (2004 – 2009): The government, making deforestation a priority under president Luis Inácio Lula da Silva, banned farming in nearly half of the Amazon rainforest, as opposed to the original ban on only one-sixth of the area. Additionally, buyers of Brazil’s soybeans declared they would not purchase crops on land cleared after July 2006, discouraging deforestation.
  • Stage 3 (2009 – present): The government banned farmers in the 36 counties with the worst deforestation rates from getting cheap credit until rates fell. Furthermore, a proper land registry, which required that farmers report their properties’ boundaries, was created.

deforestation

Clearly, as the graph above reveals, Brazil has had great success over the last decade at protecting its forests and preventing deforestation. More amazing, even with these regulations to improve environmental degradation, Brazil has had a dramatic increase in food output. Thus, Brazil is proof that a country can achieve environmental and economic gains simultaneously. Although these government regulations would not likely succeed in the United States, perhaps Brazil serves as a model for the U.S. for its priority on environmental protection.

Although forest composes less percent area of the U.S. than it does in Brazil, protecting the infrastructure, creating more efficient energy resources, and improving resource management in the U.S. would serve useful for the economy and the environment. Additionally, as Brazil is proof, improving the environment does not necessarily mean hindering the economy. While regulating carbon emissions in the U.S. will likely cause more economic turmoil, using the bright green framework as the basis for future environmental policy may have success from both the economic and environment perspectives.

Tanner Davis is a research associate at the National Center for Policy Analysis.

Adaptation Strategies for Climate Change

Although negligibly, climate change is happening, and addressing the issue in the short-term may prevent drastic future effects. When determining how to actually address climate change, two main strategies exist: mitigation and adaptation. While these two may appear similar, a nuanced difference distinguishes the two. Mitigation addresses the causes of climate change, while adaptation addresses the effects of climate change. Even though adaptation is a form of mitigation, it attempts to mitigate the harmful effects, not the causes. According to the Environmental Protection Agency (EPA), adaptation strategies can be either protective (guarding against the negative impacts of climate change) or opportunistic (taking advantage of any beneficial effects of climate change).

While an exact range is not agreed upon, most studies predict that the global mean in temperature has and will continue to rise. Some predict marginal gains, while others predict a drastic spike. Nevertheless, most agree that climate change is happening, and the evidence clearly reveals a trend in increasing temperatures. However, even though a consensus exists with regards to the veracity of climate change, no consensus exists on its causes. If the exact causes are unknown, nations spending money on mitigation strategies are taking shots in the dark at trying to stop climate change. Thus, nations may find adaptation measures more economically sensible than mitigation, as these strategies are a guaranteed way of protecting society.

As adaptation clearly appears the appropriate method of addressing climate change, many different strategies have been proposed to protect various sectors and industries. However, while the strategies may differ, the process of planning effective adaptation strategies tends to follow a similar, cyclical pattern for most nations. Here are the most common and effective six steps, according to the National Research Council:

  1. Identify current and future climate changes relevant to the system.
  2. Assess the vulnerabilities and risks to the system.
  3. Develop an adaptation strategy using risk-based prioritization schemes.
  4. Identify opportunities for co-benefits and synergies across sectors.
  5. Implement adaptation options.
  6. Monitor and reevaluate implemented adaptation options.

With this established methodology for discovering and implementing adaptation strategies, the EPA has given various examples of policies for each sector.

SECTOR ADAPTATION STRATEGY
Agriculture and Food Supply
  • Breed crop varieties that are more tolerant of heat, drought, and water logging from heavy rainfall or flooding
  • Protect livestock from higher summer temperatures by providing more shade and improving air flow in barns
Coasts
  • Promote shore protection techniques and open space preserves that allow beaches and coastal wetlands to gradually move inland as sea levels may rise.
  • Identify and improve evacuation routes and evacuation plans for low-lying areas, to prepare for increased storm surge and flooding.
Ecosystems
  • Protect and increase migration corridors to allow species to migrate as the climate changes.
  • Promote land and wildlife management practices that enhance ecosystem resilience.
Energy
  • Increase energy efficiency to help offset increases in energy consumption.
  • Harden energy production facilities to withstand increased flood, wind, lightning, and other storm-related stresses.
Forests
  • Removing invasive species.
  • Promoting biodiversity and landscape diversity.
  • Collaborating across borders to create habitat linkages.
  • Managing wildfire risk through controlled burns and thinning.
Human Health
  • Implement early warning systems and emergency response plans to prepare for changes in the frequency, duration, and intensity of extreme weather events.
  • Plant trees and expand green spaces in urban settings to moderate heat increases.
Society
  • Developing plans to help elderly populations deal with more extreme weather.
  • Relocating communities where in-place adaptation is not feasible.
  • Considering how the private sector can support and promote adaptation.
  • Understanding the specific needs of sensitive populations.
Transportation
  • Raising the level of critical infrastructure.
  • Changing construction and design standards of transportation infrastructure, such as bridges, levees, roads, railways, and airports.
  • Abandoning or rebuilding important infrastructure in less vulnerable areas.
Water Resources
  • Improve water use efficiency and build additional water storage capacity.
  • Protect and restore stream and river banks to ensure good water quality and safe guard water quantity

Often times, an effective strategy takes the dual-mandate approach, implementing adaptation and mitigation processes. However, with mitigation looking less effective each day, going all in on necessary adaptation strategies seems to be more appropriate. While mitigation strategies may buy a little more time in the long-run, adaptation strategies must take precedence as they will have definitive positive impacts. Rather than implementing new regulations to curb carbon emissions or regulate business, the federal government should work to prioritize the protection of these industries.

Tanner Davis is a research associate at the National Center for Policy Analysis.

Comparing Protocols: Successes, Failures, and Recommendations

A recent New York Times article — “Trying to Reclaim Leadership on Climate Change” — reports the longstanding indifference toward climate change. In fact, President Obama’s proposal of new rules to cut emissions at power plants makes him one of the few political leaders with a serious agenda on the issue. However, even Mr. Obama’s noble attempt will remain futile if the rest of the world is unwilling to follow suit. With the ineffectiveness at recent protocols, it is worth comparing two protocols to determine how to address the issue going forward and why Mr. Obama is trying to reclaim leadership on the issue.

Montreal Protocol

  • When: September 16, 1987
  • Where: Montreal, Canada
  • Issue: Depletion of the ozone layer and Chlorofluorocarbons (CFCs)
  • Successful?: Yes

With the discovery that certain substances, notably CFCs, were rapidly depleting the ozone layer, many nations sought to solve the issue but recognized that this issue transcended every individual border. Since the ozone layer belongs to all nations not simply one, it was the responsibility of all nations to address the pressing issue. Thus, as a multilateral force, they concocted a plan to slow the depletion of the ozone layer so it could recover. As stated, the protocol would phase-out CFCs from commercial production, particularly in the aerosol industry. And it has worked!

Considered a major multilateral success, the Montreal Protocol is persistently touted as the prime example of how well nations can work together on global environmental issues. But why was it successful? The Montreal Protocol had the perfect combination of factors: hegemons (U.S. and U.K.) taking the lead, a short timeframe before the ozone was projected to dissolve, a great mutuality of interests among the attending parties, and concentrated benefits with distributed costs.  Due to all of these factors, 197 parties have already ratified the protocol, making it the poster child for a successful multilateral operation on environmental regulation.

Kyoto Protocol

  • When: December 11, 1997
  • Where: Kyoto, Japan
  • Issue: Anthropogenic greenhouse gas (GHG) emissions
  • Successful?: No

Attempting to ride the success of Montreal, nations reconvened to address another environmental matter: anthropogenic GHG emissions causing climate change. However, this time the result was not so successful, for a few reasons. First of all, the major hegemons were hesitant to take the lead, as limiting carbon emissions could severely harm industries and make energy prices very expensive. Second, since there was no general consensus as to when climate change would occur, who or what caused it, and how drastic the effects were going to be, many parties shied from ratifying a protocol that could potentially not offer any ecological benefit. Third, a carbon cap would hinder developing economies that were just now going through their own industrial revolutions more so than nations with already developed economies, resulting in a discordance of interests. Finally, because every nation would be sacrificing economic growth for uncertain environmental security, each nation would bear concentrated costs with diffused benefits. Nevertheless, 55 nations ratified the protocol, committing to reduce carbon emissions 5 percent by 2010 and 10 percent by 2020. However, CBC news confirmed the failure of Kyoto, citing a 58 percent increase in emissions within the past decade.

U.S. Policy Going Forward

Clearly, Montreal was much more successful than Kyoto for a variety of reasons. With the success in Montreal and other protocols attempting to address the issues raised by Kyoto, Obama proposed domestic rules to limit carbon emission in the United States. Whether or not his policy will curb climate change is up for debate. However, Obama recognizes that if another multilateral environmental success is to occur in the future, the United States must take the lead to ensure that others. Additionally, the U.S. must offer incentives for other nations to also commit to the same goals. Without the support of other nations, Obama’s proposal will result in substantial economic costs with minimal ecological benefits.

Tanner Davis is a research associate at the National Center for Policy Analysis.

EPA Advancing on Numerous Fronts

The Environmental Protection Agency has been all over the new recently with a flurry of activity. Joining the President’s strategy of going forward with their agenda and without Congress, the EPA is taking bold steps while receiving some harsh criticism.

The latest action by the EPA directs bold new standards/regulations on carbon emissions. According to the EPA, by 2030:

  • Cut carbon emission from the power sector by 30 percent nationwide below 2005 levels, which is equal to the emissions from powering more than half the homes in the United States for one year.
  • Cut particle pollution, nitrogen oxides, and sulfur dioxide by more than 25 percent as a co-benefit.
  • Avoid up to 6,600 premature deaths, up to 150,000 asthma attacks in children, and up to 490,000 missed work or school days — providing up to $93 billion in climate and public health benefits.
  • Shrink electricity bills roughly 8 percent by increasing energy efficiency and reducing demand in the electricity system.

While the EPA clearly states some benefits to the new carbon emissions regulations, greater consequences could result from such carelessly calculated action. Electricity rates could skyrocket and the entire economy suffer.

According to the Heritage Foundation there will be serious economic damage:

  • Cumulative gross domestic product (GDP) losses are nearly $7 trillion by 2029 (in infla­tion-adjusted 2008 dollars), according to The Heritage Foundation/Global Insight model (described in Appendix A).
  • Single-year GDP losses exceed $600 billion (in inflation-adjusted 2008 dollars).
  • Annual job losses exceed 800,000 for several years.
  • Some industries will see job losses that exceed 50 percent.

Further action by the EPA has modified the Clean Water Act and directly affects the definition of water ways and the productive aspects of agriculture. EPA also modified the Reasonable and Prudent Alternative (RPA).

The EPA ruling on carbon emission gives the opponents of the Keystone XL Pipeline greater hope that they will succeed in their fight on the pipeline front.

“Going it alone” is a reckless decision for the entire Obama administration. Already reinforcing greater partisan divisions in Washington, completely ignoring entire branches of our government will only lead to greater problems for our entire country.

Free-flow Highways and Pricing Reduce Congestion and Emission

Conventional wisdom suggests that the most effective way to reduce light-duty vehicle emissions in metro areas is by reducing car travel. Many planners and policy makers have embarked on a policy of removing freeways, adding road diets, installing speed humps and making life miserable for commuters. However, conventional wisdom is completely wrong.

Much of the emissions in large metro areas come from carbon dioxide and volatile organic compounds. And most of those emissions occur when cars are traveling in stop and go traffic rather than free-flow speeds. Barth, a professor of Electrical Engineering and Boriboonsomsin, an Environmental Research Scientist at the University of California Riverside found that for Carbon Dioxide and Nitrogen Oxides, emissions versus speed is a U-shaped pattern where cars traveling at free-flow speeds (between 40-70 miles per hour) release less carbon dioxide than cars traveling in stop and go patterns (speeds between 0 and 30 miles per hour). In other words, eliminating stop and go traffic and severe congestion improves the environment far more than restricting car travel. In fact study authors found that with adopted tighter vehicle fuel efficiency requirements and engine technology, increasing free flow travel speeds to 40 miles per hour is by far the most effective way to reduce emissions in the light duty vehicle fleet. And most major metro areas face numerous corridors with congested traffic from six to twelve hours per day.

The most effective way to add this needed capacity is to add variably priced express lanes on freeways which provide an option for the driver (the pricing is dependent on congestion to keep traffic moving at 45 miles per hour or higher). For busy arterials the principal is the same. Commuters could use variably priced bridges to keep traffic moving at 35 miles per hour or higher. On both types of roads, the priced lanes are completely optional. The priced lanes would be new; commuters would always have the option of using the existing free lanes.

In addition to having the users pay for a large part of the improvement, this policy would increase speed and decrease congestion. This pricing also encourages people to travel only as needed, reducing induced demand (the tendency of new roads to generate new car trips), which is the reason most planners dislike freeway and arterial improvements. Such improvements would also improve the fuel efficiency of buses and improve transit service. If the goal is to improve the environment, speeding up travel by adding lanes and pricing those lanes is the most effective solution.

Economic Consequences of Climate Change Policies

According to The Growing Benefits of a Warmer World by the NCPA, global warming has many tangible benefits to the economy. Supplementing the argument, many negative economic consequences exist from climate change policy. Thus, a two-fold offensive argument exists: global warming helps the economy and policies to curb warming hurt the economy.

A study conducted by the Heritage Foundation found that carbon policies with very lofty targets and goals, such as the Waxman-Markey legislation (an 80 percent cut in CO2 emissions by 2050) passed by the House of Representatives in 2009, would have long-term detrimental economic effects:

  • An aggregate income loss to the U.S. of $207.8 trillion by 2100.
  • An aggregate income loss worldwide of $109.6 trillion by 2100.
  • A one-year worldwide loss of $3.5 trillion in 2100, equivalent to 4.75 percent of U.S. Gross Domestic Product.
  • Adverse impacts, on net, in every year of implementation.

Even more startling, these numbers assume that the U.S. is the only country to enact a carbon policy. The numbers skyrocket when including the rest of the world implementing similar policies. As such, while these policies may address environmental degradation, the negative economic effects greatly outweigh the positive results in all aspects of the “cost-benefit analysis.” In fact, having a stronger economy will help society to overcome the negative effects of climate change. Stronger economies have much easier accessibility to and flexibility with adaptation strategies.

Additionally, taken from a report by the Council on Foreign Relations,

Lawmakers and industry leaders worry that such greenhouse-gas caps in the United States will reduce the ability of U.S. companies to compete with foreign imports, leading U.S. companies to move to countries without greenhouse-gas restrictions, which is often termed ‘leakage’.

This same report offers many solutions to these qualms, but concludes that attempts to offset economic harm would pose a number of hurdles. While the end of this report also suggests economic benefits for these policies, the increased cost of domestic energy offsets any potential benefits.

Thus, instead of having the federal government apply more regulations and issue further policies to curb carbon emissions, the United States should encourage more private sector development to adapt to and mitigate the effects of impending climate change.

The U.S. should actually follow the example set forth by the United Nations via its Private Sector Initiative. By allowing for a unified database of case studies, companies all over the world can view actions implemented by other companies to reduce risks to their business operations. Many of these case studies also offer strategies for investing in adaptation action in vulnerable regions in a sustainable and profitable manner. This model for preventative and adaptive action is exactly what the U.S. should follow, as it filters and disperses innovative ideas throughout the private sector at a time when the federal government remains inefficient in addressing these issues.

Tanner Davis is a research associate at the National Center for Policy Analysis.

Balancing Environmental and Economic Concerns

While climate change is a consideration for most Americans, some metro areas are adopting unnecessary draconian growth restrictions. The best example may be the state of California. California Assembly Bill 32 mandates that by 2020 the state reduce its greenhouse gas emissions to 1990 levels. Research indicates that the state has just about reached that goal. But instead of celebrating that goal, California lawmakers want to go much farther. Assembly member Quirk has introduced a bill to plan for carbon reductions of 80% by 2050. A 2012 report by Greenblatt and Long found that commercially available technology would be sufficient to enable California to reduce greenhouse gases by 60% by 2050. However, meeting the 80% threshold will require technological advances.

Over the last twenty years, the Los Angeles region has actually lost jobs. Between 2001 and 2011 alone, L.A. County lost 7.1 percent of its jobs. Since 1990 the region has lost 150,000 manufacturing jobs. While all metro areas have lost manufacturing jobs, Los Angeles has lost the second highest number in the country; and those jobs made up a larger percentage of the economy than first place New York. And while poor leadership and national factors have contributed to these losses, the biggest factor may be environmental regulations. Many of Los Angeles’ industrial jobs have moved to other states such as Texas with looser environmental laws. Obtaining an 80% reduction in greenhouse gases would require the city to control emissions from ships and trucks at the Ports of L.A. and Long Beach. Yet the ports are the largest and second largest container ports in the country and supply a significant percentage of metro area jobs. The ports are the biggest supplier of manufacturing jobs.

While an 80% reduction in greenhouse gases may be desirable, it will also eliminate some of the few manufacturing jobs in the region. Los Angeles needs to be increasing not decreasing the number of blue-collar jobs. And manufacturing jobs are high-paying quality jobs. In a region with major economic problems, a little balance could go a long way.

Global “Clean” Energy Expenditures are Down (and Respect for Economic Realities are Up) in 2013

It is refreshing to see that environmentalists and liberal governments are beginning to recognize the economic realities they face when manipulating energy markets to promote clean, renewable energy sources. For example, a recent Time Magazine article investigates why total public and private funding of “clean power” from the global renewable energy industry fell 14% in 2013. This amounts to a decline of 23% since the peak of such spending occurred in 2011. The data cited came from a study from the Frankfurt School-UNEP and Bloomberg New Energy Finance.

This study points out that Europe decreased its spending on clean, renewable energy sources by 44% while the U.S. decreased it is spending by 10%. These reductions were found to largely arise from three economic realities:

  • The declining costs of producing “clean” energy.
  • The significant reduction in public subsidies.
  • Increased competition from renewable but “unclean” biofuels power sources.

Economic Reality #1: Subsidizing an activity can drive down the unit cost of production by creating economies of scale. For example, the average cost for installing a voltaic solar cell in the U.S. declined 60% in the last few years. Indeed, despite the reductions in total spending in 2013, global clean energy capacity in 2013 (from renewable energy sources other than existing hydroelectric power sources) had remained the same as it was in 2012. However…

Economic Reality #2: Public sector funding sources are scarce. As Europe is slowly recovering from the recent global recession, the central governments of these countries are finding it very difficult to justify costly public investments in clean energy subsidies when other popular social programs compete for survival in an environment of shrinking public sector budgets. In fact, Spain and Bulgaria made their subsidy cuts retroactive, shuttering their clean energy industries, despite the falling unit costs of providing clean energy. Further…

Economic Reality #3: Every choice has an opportunity cost that cannot be avoided.  Clean power is defined as coming from renewable, sustainable fuel sources that create very low or no pollution or greenhouse gas emissions. Environmental scientists are beginning to realize that subsidized biofuel production:

  • Pushes up global food prices, because the fuel is grown with water sources and lands that could be used for growing food, which increases food prices and makes biofuels less “sustainable”.
  • Increases water pollution levels from pesticides and insecticides, making biofuels “unclean.” Indeed, an article in the magazine Scientific American notes that, “U.N. Intergovernmental Panel on Climate Change has for the first time acknowledged the risks of uncontrolled biofuels development.”

We seem to be living in a world where national governments are intent on accelerating our adoption of clean energy sources along a time line not supported by private energy markets. At least it is refreshing to see that both governments and environmentalists are slowly (if only involuntarily) admitting to economic reality: the true scarcity of valuable resources in our world creates real and unavoidable influences on the efficacy of government policies designed to accelerate clean energy industry development. We cannot simply wave the magic wand of “hope” to force the hand of the market in a manner that ignores such economic realities.

EPA Testing Seems At Odds With Public Statements

“Call us for more information and to see if you qualify!”

What exciting opportunity might this be? How about the chance to be exposed to toxins that the researchers say can cause death.

Indeed, this cheery offer came from a set of flyers printed by the EPA seeking human testing subjects for air pollution experiments.

According to an EPA Inspector General report, during five studies conducted in 2010 and 2011, the EPA conducted experiments on 81 individuals, exposing them to airborne particles known as PM2.5 (basically, soot and dust), diesel exhaust, and ozone. Some test subjects experienced cardiac arrhythmias during the testing, and one woman, with a history of medical problems, was sent to the hospital.

The report describes the five air quality studies, expressing concern that the agency exposed a research subject above the study’s concentration targets and that the EPA’s consent forms did not address all of the risks (including death) surrounding pollutant exposure.

Moreover, only one of the studies’ consent forms “identified the upper range of pollutant exposure for each study subject.” The other four consent forms “did not mention the level of pollutant exposure. Instead, the forms…compared the subject’s level of exposure during the study to the exposure they would receive visiting major cities on smoggy days.”

Why was this info left out? The EPA justified its “smoggy days” description of the study because a study manager “explained that a person breathing 420 [micrograms per cubic meter] for 2 hours would inhale the same concentration as they would breathing 35 [micrograms per cubic meter] (the EPA’s 24-hour standard for PM2.5) for 24 hours in a city such as Los Angeles.”

(The studies actually exposed participants to PM levels of 600 micrograms per cubic meter, and one subject up to 751 micrograms per cubic meter — over 21 times the 24-hour standard!)

“The manager also stated that…the risk is small for those with no overt disease.”

Similarly, the agency failed to mention long-term cancer risks from diesel exhaust because “[a]n EPA manager considered these long-term risks minimal for short-term study exposures.”

And just two of the studies “alerted study subjects to the risk of death for older individuals with cardiovascular disease.”

The IG report provides a table detailing health impacts derived from EPA regulations and assessments from short-term exposure to particulate matter and diesel exhaust. For PM2.5, “mortality” is listed as a risk of short-term exposure.chart

What else has the EPA told us about PM2.5?

  • “If we could reduce particulate matter to levels that are healthy, we would have an identical impact to finding a cure for cancer.” — EPA Administrator Lisa Jackson, testimony in front of the Subcommittee on Oversight and Investigations, House Committee on Energy and Commerce, September 22, 2011.
  • “Particulate matter causes premature deaths. It doesn’t make you sick. It is directly causal to dying sooner than you should.” — EPA Administrator Lisa Jackson, testimony in front of the Subcommittee on Oversight and Investigations, House Committee on Energy and Commerce, September 22, 2011.
  • “Overall, there is strong epidemiological evidence linking… short-term (hours, days) exposures to PM2.5 with cardiovascular and respiratory mortality and morbidity.” — EPA report on Air Quality Criteria for Particulate Matter, Volume II, October 2004.
  • “Short-term exposures to particles (hours or days) can aggravate lung disease, causing asthma attacks and acute bronchitis, and may also increase susceptibility to respiratory infections. In people with heart disease, short-term exposures have been linked to heart attacks and arrhythmias.” — EPA brochure on Particle Pollution and Your Health.
  • “The new studies support previous conclusions that short-term exposure to fine PM is associated with both mortality and morbidity.” — EPA report on Provisional Assessment of Recent Studies on Health Effects of Particulate Matter Exposure, July 2006.
  • “The best scientific evidence, confirmed by independent, Congressionally-mandated expert panels, is that there is no threshold level of fine particle pollution below which health risk reductions are not achieved by reduced exposure.” — Letter from Gina McCarthy, Asst. Administrator of the EPA, to Rep. Fred Upton, February 3, 2012.

In these reports and statements, exposure to PM 2.5 is dangerous (indeed, there is apparently no level of pollution at which health risks cease!). But the EPA’s human testing? Apparently not so dangerous.

The IG report summed up the agency’s missing warnings about the link between PM exposure and health effects this way: “This lack of warning about PM…is also different from its public message about PM.”

When an agency hails the reduction of particulate matter as the public health equivalent of curing cancer — and regulates on that basis — it loses credibility when it exposes humans to high levels of the pollutants and deems such exposure safe.

So, has the EPA exaggerated the effects of these particles in order to justify heavy-handed regulation? Or is the agency knowingly conducting dangerous experiments on human subjects?

Whichever it is, neither answer is comforting.