Category: Property Issues

EPA and Regulatory Taking of Private Property

The Fifth Amendment to the U.S. Constitution forbids the government from taking privately owned property without the due process of law, and without just compensation. However, what constitutes a government “taking” and can “due process” be preemptively satisfied by agency regulation? It seems in the case of “wetlands”, the EPA has overreached its authority.

Let us first attempt to identify “wetlands”. According to a comprehensive classification system developed in 1979, a site can be categorized as coastal or inland, yet the classification of “wetland” is not site-specific. Instead, “wetlands” is explained as a hierarchical, progressive structure of connected waters of the state. In what is termed the Cowardin Classification System, “wetlands” is an all-encompassing geographical feature. It consists of linked layers of species and subspecies, soil types and subtypes, an assortment of vegetation, along with various water sources, movements, and duration of presence. Simply stated, a piece of ground that can receive water (including rain) is part of the system that is “wetlands”. The Cowardin System, prepared for the U.S. Fish and Wildlife Service, is an impressive, comprehensive report. Indeed, it has been the de facto standard for EPA employees in assigning a wetlands designation to private property. As a result, EPA’s authority and jurisdiction relating to “Navigable Waters” has multiplied.

As a result, many landowners have lost private property usage and development rights. Effectively, the property owner has suffered a “taking” by the federal government. Such was the case of Mike and Chantell Sackett, an Idaho couple who challenged the EPA’s enforcement actions under §404 (wetlands) of the Clean Water Act (CWA). In a 2013 decision, the Supreme Court ruled unanimously against the EPA. In essence, the agency could not deny the Sacketts a hearing to challenge the agency’s use of CWA authority and jurisdiction over their land. The Sacketts successfully argued the EPA violated their constitutional right to due process. The simple question before the Supreme Court was whether landowners have a right to challenge a legal order of the EPA? The answer was a resounding 9 to 0 “Yes”. The EPA worked to preclude the right to judicial review exercising self-assumed authority in designating wetlands. In the majority opinion, Justice Antonin Scalia wrote that the court rejected EPA’s attempt to use the CWA as a blanket fulfillment of due process. Justice Samuel Alito concurred stating Congress should clarify ambiguities in the CWA.

In the case of Rapanos v. the United States, though the court came to no decision (the parties eventually settled), four Justices spoke against the EPA. Justice Scalia wrote the EPA’s use of the term “waters of the United States” is an overreach in identification of wetlands. The concurring Justices agreed. The court found that occasional, intermittent, or ephemeral water flows may have a hydrological connection. However, “are not sufficient to qualify a wetland as covered by the CWA; it must have a continuous surface connection”.

Likewise, in Solid Waste Agency of Northern Cook County (SWANCC) v. United States Army Corps of Engineers, the Court ruled against EPA. Chief Justice William H. Rehnquist wrote the EPA overreached in its wetland designation of “isolated, abandoned sand and gravel pits with seasonal ponds, which provide migratory bird habitats”. Both the Rapanos and the SWANCC court opinions counter the Cowardin concept of all waters being connected in one wetlands system. Such decisions constitute a slap-of-the-hand by the Supreme Court to EPA and offer an opportunity to discuss the ever increasing dominance of the agency over the lives of everyday citizens.

America’s founders designed our government to serve the people. Increasingly citizens are left with little recourse but to ask the courts to assure their constitutional rights as threatened by dominant government agencies. The EPA, arguably being one of the most insidious, dictatorial federal agencies.

Fortunately, recent Supreme Court decisions and Justice Alito’s urging that Congress address ambiguities have triggered action by some. Several Senators have introduced S.980 a bill that attempts to clarify the CWA by explaining waters of the state are “Navigable-in-fact” and is “permanent, standing, or continuously flowing bodies…from streams, oceans, rivers, and lakes and are connected to waters that are navigable-in-fact“. Passing S. 980 would be a great start to corralling the EPA’s assault on private property rights. This, along with the Supreme Court ruling affirming the 5th amendment right to due process is an indication we are making headway.

Suburban Nation: U.S. 86 Percent Suburban

From Jurisdictional to Functional Analysis of Urban Cores & Suburbs

For decades there has been considerable analysis of urban core versus suburban trends. However, for the most part, analysts have been jurisdictional, comparing historical core municipalities to the expanse that constitutes the rest of the metropolitan area. Most core municipalities are themselves substantially suburban, which can mask (and exaggerate) the size of urban cores and understate the extent of suburbanization.

Our new City Sector Model evaluates the more than 8,900 zip codes in the 52 U.S. metropolitan areas that have more than 1,000,000 residents (“major metropolitan areas”) based on travel behavior and urban form. There are four categories, including  (1) Pre-Auto Urban Core, (2) Auto Suburban: Earlier, (3) Auto Suburban: Later and (4) Auto Exurban. It is recognized that automobile oriented suburbanization was underway before World War II, but it was interrupted by the Great Depression during the 1930s and was small compared to the democratization of personal mobility and home ownership that has occurred since that time.

Canada: A Suburban Nation

The City Sector Model is broadly similar to the groundbreaking research published by David L. A. Gordon and Mark Janzen at Queen’s University in Kingston Ontario (Suburban Nation: Estimating the Size of Canada’s Suburban Population) on the metropolitan areas of Canada. Gordon and Janzen concluded that the metropolitan areas of Canada are largely suburban. Among the major metropolitan areas of Canada, the Auto Suburbs and Exurbs combined contain 76 percent of the population, somewhat less than the 86 percent in the United States.

All U.S. Major Metropolitan Area Growth Has Been Suburban and Exurban

Virtually all population growth in U.S. metropolitan areas (as currently defined) has been suburban or exurban since before World War II (the 1940 census). The historical core municipalities that have not annexed materially and were largely developed by 1940 have lost population. Approximately 110 percent of their metropolitan area growth has occurred in suburbs and exurbs. Further, among the other core municipalities, virtually all of the population growth that has occurred in annexed areas or greenfield areas since 1940.

Identifying the Pre-Auto Urban Core

Not being constrained by municipal boundaries is important because core municipalities vary substantially. For example, the core municipality represents less than 10 percent of the population of Atlanta, while the core municipality represents more than 60 percent of the population of San Antonio. The City Sector Model applies data available from the U.S. Census Bureau to estimate the population and distribution of Pre-Auto Urban Cores in a consistent manner.

At the same time, the functional analysis is materially different from the Office of Management and Budget (OMB) classification of “principal cities.” It also differs from the Brookings Institution “primary cities,” which is based on the OMB approach. The OMB based classifications classify municipalities using employment data, without regard to urban form, density or other variables that are associated with the urban core. These classifications are useful and acknowledge that the monocentric nature of US metropolitan areas has evolved to polycentricity. However, non-urban core principal cities and primary cities are themselves, with few exceptions, functionally suburban (some of the most significant examples are Mesa, Arizona in the Phoenix area, which had a population of only 7,000 in 1940 and Arlington, Texas, in the Dallas-Fort Worth area, which had a population of only 4,000. Their populations, now both 350,000 or more are virtually all automobile oriented suburban).

The City Sector Model Criteria

Because of the substantial interest of urban planners in minimizing the use of automobiles and restoring transit, walking and cycling as primary urban travel alternatives, it is important to identify the extent of automobile oriented suburbanization to the greatest extent possible. Better information is required, regardless of an analysts’ orientation. (As an aside, this author believes that the data shows planning efforts to lead to lower standards of living and greater poverty, which is discussed in Toward More Prosperous Cities).

A number of data combinations were tested for the Pre-Auto Urban Core, to replicate as closely as feasible the 2010 population of the core municipalities that have virtually the same boundaries as in 1940 and that were virtually fully developed by that time (the Pre-War & Non-Suburban classification in historical core municipalities). The following criteria were accepted (represented graphically).

  •  The Auto Exurban category includes any area outside a principal urban area.
  •  The Pre-Auto Urban Core category includes any non-exurban with a median house construction date of 1945 or before and also included areas with a population density of 7,500 per square mile (2,900) or more and with a transit, walk and cycling journey to work market share of 20 percent or more.
  •  The Auto Suburban Earlier category included the balance of areas with a median house construction date of 1979 or before.
  •  The Auto Suburban Later category later included the balance of areas with a median house construction date of 1980 or later.

Additional details on the criteria are in the Note.

Results: 2010 Census

 The combined Pre-Auto Urban Core areas represented 14.4 percent of the population of the major metropolitan areas in 2010 (2013 geographical definition). This compares to the 26.4 percent that the core municipalities themselves represented of the metropolitan areas, indicating their large functionally suburban components.

The Auto Suburban: Earlier areas accounted for 42.0 percent of the population, while the Auto Suburban: Later areas had 26.8 percent of the population. The Auto Exurban areas had 16.8 percent of the population.

The substantial difference between U.S. and Canadian urbanization is illustrated by applying an approximation of the Gordon-Janzen criteria, which yielded an 8.4 percent Pre-Auto Urban Core population. The corresponding figure for the six major metropolitan areas of Canada was 24.0 percent. This difference is not surprising, since major Canadian urban areas have generally higher densities and much more robust transit, walking and cycling market shares. Yet, the Gordon-Janzen research shows Canada to be overwhelmingly suburban.

Population Density: As would be expected, the Pre-Auto Urban Core areas had the highest densities, at 11,000 per square mile (4,250 per square kilometer). The Auto Suburban: Earlier areas had a density of 2,500 per square mile (1,000 per square kilometer), while the Auto Suburban: Later had a population density of 1,300 per square mile (500 per square kilometer), while the Auto Exurban areas had a population density of 150 per square mile (60 per square kilometer).

Individual Metropolitan Areas (Cities)

The metropolitan areas with the highest proportion of Pre-Auto Urban Core population are New York (more than 50 percent), and Boston (nearly 35 percent), followed by Buffalo, Chicago, San Francisco-Oakland and Providence, all with more than 25 percent.

It may be surprising that many of the major metropolitan areas are shown with little or no Pre-Auto Urban Core population. For example, five metropolitan areas have no Pre-Auto Urban Core population, including Phoenix, Riverside-San Bernardino, Tampa-St. Petersburg, Orlando, Jacksonville and Birmingham. By the Census Bureau criteria of 1940, two of these areas were not yet metropolitan and only Birmingham (400,000) had more than 250,000 residents. Only the larger metropolitan had strong Pre-Auto Urban Cores. Many of the newer and fastest growing metropolitan areas were too small, too sparsely settled or insufficiently dense to have had strong urban cores before the great automobile suburbanization that followed World War II. Further, many of the Pre-Auto Urban Cores have experienced significant population loss and some of their neighborhoods have become more suburban (automobile oriented). Virtually no urban cores have been developed since World War II meeting the criteria.

Thus, no part of Phoenix, San Jose, Charlotte and a host of other newer metropolitan areas functionally resembles the Pre-Auto Urban Core areas of metropolitan areas like Chicago, Cincinnati or Milwaukee. However, new or expanded urban cores are possible, if built at high enough population density and with high enough transit, walking and cycling use.

Despite the comparatively small share of the modern metropolitan area represented by the Pre-Auto Urban Core in the City Core Model, the definition is broad and, if anything over-estimates the size of urban core city sectors. The population density of Pre-Auto Urban Core areas is below that of the historical core municipalities before the great auto oriented urbanization (11,000 compared to 12,100 in 1940) and well above their 2010 density (8,400), even when New York is excluded. The minimum density requirement of 7,500 per square mile (not applied to analysis zones with a median house construction data of 1945 or earlier) is slightly less than the density of Paris suburbs (7,800 per square mile or 3,000 per square kilometer) and only 20 percent more dense than the jurisdictional suburbs of Los Angeles (6,400 per square mile or 2,500 per square kilometer). Some urban containment plans require higher minimum densities, not only in urban cores but also in the suburbs.

The United States: An Even More Suburban Nation

In describing the Canadian results, Professor Gordon noted that there is a tendency to “overestimate the importance of the highly visible downtown cores and underestimate the vast growth happening in the suburban edges.” That is true to an even greater degree in the United States.

—–

Note: The City Sector Model is applied to the 52 major metropolitan areas in the United States (over 1 million population). The metropolitan areas are divided into the principal urban areas, with areas outside categorized as exurban. The principal urban areas in Los Angeles and San Francisco encompass the smaller Mission Viejo and Concord urban areas, which are adjacent. As a result, some smaller urban areas, such as Palm Springs (Riverside-San Bernardino metropolitan area), Lancaster (Los Angeles metropolitan area) and Poughkeepsie (New York metropolitan area) are considered exurban. Areas with less than 250 residents per square mile (100 per square kilometer) are also considered exurban, principally for classification of large areas on the urban fringe that have a substantial rural element.

The Pre-Auto Urban Core includes all non -– exurban areas in which is the house construction date is 1945 or before. In addition, the urban core includes areas that have a population density of 7,500 per square mile (2,900 per square kilometer) or more and a transit, walking and cycling journey to work market share of 20 percent or more, so long as they are in the urban area.

The analysis zones (zip codes) have an average population of 19,000, with from as many as 1,000 zones in New York to 50 in Raleigh.

—–

This article is adapted from From Jurisdictional to Functional Analysis of Urban Cores and Suburbs, originally published in newgeography.com. That article contains charts, tables and representative maps.
Smart Growth: Destroying Housing Opportunity from California to Australia (and Beyond)

Two recent stories provide further  evidence on the extent to which urban containment policies (also called smart growth, growth management, compact city policy, livability and urban consolidation) raises house prices relative to incomes, thereby reducing housing affordability. Because housing represents the largest element of household budgets (not transportation as a US government website implies), urban containment policy reduces discretionary income — the money households have left over after taxes and paying for necessities. This leads to a lower standard of living and more poverty, and violates the fundamental purposes of urban planning, described by former World Bank principal planner Alain Bertaud as:

“Increasing mobility and affordability are the two main objectives of urban planning. These two objectives are directly related to the overall goal of maximizing the size of a city’s labor market, and therefore, its economic prosperity.”

Two recent stories describe the effects of urban containment policy on the standard of living:

The Economist and Urban Containment “Fat Cats”

“Free Exchange” in The Economist came  down strongly on the side of economics in a review of housing affordability.

According to The Economist, the unusually high cost of housing in San Francisco (and other places) is principally the result of tight land use regulation, which makes it expensive or impossible to build. If “local regulations did not do much to discourage creation of new housing supply, then the market for San Francisco would be pretty competitive.” Add to that Vancouver, Sydney, Melbourne, Toronto, Portland and a host of additional metropolitan areas, where urban containment policy has driven house prices well above the 3.0 median multiple indicated by historic market fundamentals.

The Economist explains the issue in greater detail: “We therefore get highly restrictive building regulations. Tight supply limits mean that the gap between the marginal cost of a unit of San Francisco and the value to the marginal resident of San Francisco (and the market price of the unit) is enormous. That difference is pocketed by the rent-seeking NIMBYs of San Francisco. However altruistic they perceive their mission to be, the result is similar to what you’d get if fat cat industrialists lobbied the government to drive their competition out of business.” (Our emphasis).

Of course urban planning interests have long denied that that rationing land is associated with higher housing prices (read greater poverty and a lower standard of living). Nonetheless urban containment policies not only drive up the price of land, but do so even as they reduce the amount of land used for each new residence, driving prices per square foot of land up as well.

The Economist notes that unless the direction is changed, housing policy will continue to be “an instrument of oligarchy. Who knows. But however one imagines this playing out, we should be clear about what is happening, and what its effects have been.”

Land Prices Skyrocket as Residential Lot Sizes Fall in Australia

The extent to which smart growth policy (urban continament policy or urban consolidation policy) is associated with higher land (and house) prices is illustrated by a recent press release from RP Data in Australia. The analysis examined the vacant building lot prices for the period of 1993 to 2013.

During the period, the median price of a vacant lot rose 168 percent after adjustment for inflation.This is nearly 5 times the increase in the median household incomes of the seven largest capital cities (Sydney, Melbourne, Brisbane, Perth, Adelaide, Canberra and Sydney).

But it gets worse. The median lot size was reduced nearly 30 percent. This should put paid to the myth that urban containment reduces lot prices as it reduces their sizes. The same dynamic has been indicated in the United States.

Australia has been plagued by huge house cost increases relative to incomes in association with urban containment policy. Before the adoption of urban containment policy, it was typical for house prices to average three times or less than that of household income. Now, Sydney has the highest median multiple (median house price divided by median household income) of any major metropolitan area in the New World, with the exceptions of Vancouver and San Francisco. Melbourne, the second largest metropolitan area in Australia, has a median multiple of 8.4, making it fifth most costly in the New World, behind San Jose. All of Australia’s major metropolitan areas are “severely unaffordable,” including slow-growing Adelaide (6.3), as well as most smaller areas.

Getting Priorities Right

Research on these impacts led London School of Economics professor Paul Cheshire to conclude that urban containment policy is irreconcilable with housing affordability. This means that urban containment policy is irreconcilable with a better economic future for households, including those in poverty.

The purposes of urban containment policy are largely driven by a particular vision of the urban form and a manifestly wrongheaded belief that rationing land and limiting mobility can contribute materially to reducing greenhouse gas emissions. The issue is neither urban design nor the expensive and ineffective strategies of urban containment. People are more important — their standard of living and reducing the number living in poverty. There is a compelling need to reorient urban policy in this direction (see Toward More Prosperous Cities).

—–

For a complete listing of median multiples by major metropolitan area, see the 10th Annual Demographia International Housing Affordability Survey.

Additional information on the RP Data research is available at Australian Property Through Foreign Eyes

—–

Note: This article is adapted from contributions by the author to the newgeography.com

Emiminate Insurers of Last Resort

The reaction to Superstorm Sandy’s $65 billion in damage has been the predictable doom and gloom about climate change and rising sea levels. But instead of implementing draconian restrictions, we can prevent loss of life and property by eliminating insurance of last resort.

Extreme weather is nothing new. Paris was flooded on a regular basis by the Seine River until Napoleon III built walls for flood prevention. But while it was logical for earlier generations to live on higher ground away from major bodies of water, it now seems logical to us to build as close to the ocean as possible. Boston, New York City and much of the population in the state of Florida is flood prone. Between 1970 and 2000, East Coast areas grew in population. When four hurricanes hit Florida in 2004 and Superstorm Sandy hit the northeast in 2012, many people incurred major property losses.

Insurance companies made poor decisions to cover some of these properties. But most companies have adjusted their portfolio. Yet instead of letting the market work and forcing folks who rebuild homes on barrier islands to go without coverage, many states stepped into the game by providing insurance of last resort. Premiums for these policies are offered below market rate with taxpayers subsidizing the difference. For example in Miami-Dade County, FL the insurance premium on a $150,000 house with Citizens (the Florida insurer of last resort) costs $4,600. With a traditional insurance company the premium is $10,000. Worse, some states actually encouraged the private sector to dump questionable policies into the last resort pool.

If private insurers cannot provide insurance to certain coastal location, this is a signal that building a home in this location is a poor decision. And if one of these homes is going to get damaged by the next storm, it is not a good policy decision to encourage folks to live there. If the private sector cannot provide insurance to folks building new homes, the government should not provide it either. Current homeowners can be transferred over time to the private market, assuming they do not get hit by multiple storms. Potential owners can still build in hurricane prone areas, but taxpayers should not bail them out when the inevitable next storm strikes.

How The West Was Won – By The Feds

Well sometimes feels like we never won it when so much of our land and resources are under the direct control of the U.S. government and tribal authorities. If you take a look at the American “west”, you will see a very big difference from the other half of the country in terms of land owned by the government and land that is “free” to own by the public.

The federal government owns approximately 29% of the land area in the United States, more than 653 million acres. The U.S. General Services Administration’s report on Federal Real Property Profile, 2004 shows how much land the government owns in each state. The top 10 federally owned states:

  • Nevada 85%
  • Alaska 69%
  • Utah 57%
  • Oregon 53%
  • Idaho 50%
  • Arizona 48%
  • California 45%
  • Wyoming 42%
  • New Mexico 42%
  • Colorado 37%

Out of the top 10 states (all are in the American “west”), the federal government owns 505 million acres or 77% of the total land area owned in the United States by the federal government.

The White House acknowledges the fact that not only is the United States government the largest property owner in the country, but also a major source of government waste because of this fact. Efforts to make much of this property available to the public for purchase have been minimal. The White House Federal Excess Properties site shows the federal government’s effort in selling off properties.

The Federal Government is the biggest property owner in the United States, and billions of taxpayer dollars are wasted each year on government properties that are no longer needed. The President has proposed an independent Civilian Property Realignment Board to help the Federal Government cut through red tape and competing stakeholder interests to sell or get rid of property it no longer needs. Over time, this could save taxpayers billions of dollars and help to reduce the deficit.

This map shows just the tip of the iceberg in terms of opportunities for downsizing the Federal real estate portfolio. Under the President’s proposal, more properties, in some cases with significant market value, would be added to this map and dealt with more quickly and effectively than they are today.

President Obama and Vice President Biden launched the Campaign to Cut Waste to eliminate misspent tax dollars in every agency and department across the Federal Government. Getting properties like those highlighted below off our books is a key first step in this effort.

The Civilian Property Realignment Board was cancelled by congress and a very painful and slow process for eliminating this waste is still in place.

Before any agency sells a surplus property, it is required by federal law to ensure that no other U.S. agency wants it. It must then offer a right of first refusal to state and local governments as well as nonprofits. Buildings must be assessed as potential homeless shelters and reviewed for environmental contamination and historic significance.

All of these federally owned properties have the potential to be transferred to state/local governments or to private interests. Benefits could include:

  • less government waste of resources and taxpayer dollars
  • increased efficiency of remaining federal properties
  • greater use of agriculture, energy and natural resources for private use

The bipartisan Federal Real Property Asset Management Reform Act of 2013 is intended to expedite the sale of federal property that is underutilized. A greater effort in this direction is very obvious and needed.

Obama Administration: Putting Species above People and the Constitution

A couple of weeks ago, I noted the Obama administration’s hypocrisy concerning protecting endangered species from harm (in this case the California condor) when it runs up against the President’s preferred energy sources – wind energy in this instance.

Barely a week later and two new stories arise showing that though the administration values wind turbines more than condors, it values condors and other species more than your average citizen and his or her property.

To put the value scale in perspective:

  • ·         Expensive, unreliable green energy > condors and other endangered species > average U.S. citizen.

CNN has publicized an ongoing dispute in Tombstone, AZ, where the U.S. Forest Service is refusing to let the city rebuild its water system; a system destroyed by wildfires and floods.  Despite a clear chain of title, previous court victories backing Tombstone’s claim and multiple rebuilding projects carried out with the Federal government’s past approval, the USFS will only allow Tombstone to rebuild the pipeline with shovels and picks and horses – no mechanized equipment, with even wheelbarrows being considered mechanized.  Absent the pipeline, the city’s residents are faced with moving out and on or drilling more wells in an area where arsenic in wells is not uncommon.  Faced with such choices, Tombstone has sued the Administration in a case that will likely end up before the United States Supreme Court.  One can only wonder how it has come to this.  This should highlight the need for legislators, states and communities to look at the potential long-term harms that could result if a new wilderness area is carved out of their lands or if new species are declared endangered.  This is a fascinating story and should be read in full.

In another case directly bearing upon the California condor’s standing, it seems that a large condo (one name for a group of condors) have taken up residence in a particular California valley.  When the condors initially moved in the residents were charmed and amazed, but those feeling changed rather quickly as the damages that condors can cause quickly became evident.  The huge birds have pecked off roof shingles, damage air conditioners, destroyed screens and the frames for doors and windows an have and left porches, patios and decks coated in foul smelling, potentially harmful droppings.  For many species, such harms could be solved by harassing them or calling pest or animal control.  Not for condors, they are protected and can’t even be harassed or shooed off.  Mind you, these problems are not an act of God, the federal government reintroduced these birds into the wild, but now claim they have no responsibility for the damage they cause.  This claim would not fly for any other government program supposedly carried out for the public benefit.  What happened to paying takings when private property is damaged or basically controlled by the government in furtherance of a public purpose.  As sad as this situation is, I’m glad it’s occurring in California – the citizens are reaping what they are trying to by pushing misanthropic environmental laws across the whole nation.

Smart Growth/Urban Containment Continue to Drive Unaffordable Housing in 7 Nations

We have just released the 9th Annual Demographia International Housing Affordability Survey covering 337 metropolitan markets in Australia, Canada, China (Hong Kong), Ireland, New Zealand, the United Kingdom and the United States. As usual, the most unaffordable markets are those in with urban containment policy (also called by other names, such as smart growth and compact cities policy). The Survey uses the Median Multiple to evaluate housing affordability.

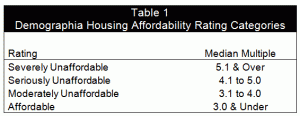
The Demographia International Housing Affordability Survey employs the “Median Multiple” (median house price divided by gross before tax annual median household income) to rate housing affordability (Table 1). The Median Multiple is widely used for evaluating urban markets, and has been recommended by the World Bank and the United Nations and is used by the Harvard University Joint Center on Housing.

Historically, among the metropolitan areas outside Hong Kong, the Median Multiple was typically at 3.0 or below, before the adoption of urban containment policies. Urban containment policies ration land for development, and as economics would predict, this raises the price of land and thus the price of housing.

Severely Unaffordable Major Markets

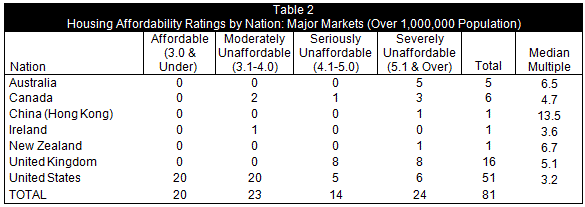
The most unaffordable major markets (over 1,000,000 population) are Hong Kong, with a Median Multiple of 13.5, Vancouver with a median multiple of 9.5 and Sydney with a median multiple of 8.3 (Table 2).


The most severely unaffordable US major markets (over 1 million population) are San Jose, at 7.9, San Francisco, at 7.8, San Diego, 6.4, New York, 6.2, Los Angeles, 6.2, and Boston, 5.1. Each of these markets experienced a substantial house price escalation during the housing bubble and a substantial loss in house prices when the bubble burst.

In Canada, both Toronto (5.9) and Montréal 5.1 were rated severely unaffordable, in addition to Vancouver.

All major markets in land rich Australia are rated severely unaffordable, including Sydney (9.3), Melbourne (7.5), Brisbane (5.8) , Perth (5.9) and slow-growing Adelaide (6.5). New Zealand’s only major market, Auckland is also rated severely unaffordable, at 6.7

Among metropolitan areas with less than 1 million population, Honolulu was the most unaffordable in the seven nations, at 9.3.

In the United Kingdom, London (7.8), the London exurbs (6.8), Plymouth (7.3), Bristol (5.7), economically depressed Liverpool (5.3), economically depressed Newcastle (5.2), Birmingham (5.1) and Sheffield (5.1) were also rated severely unaffordable.

Affordable Markets

At the same time, affordable markets remain, even in the metropolitan areas with the highest growth rates. For example, Dallas-Fort Worth, Houston and Atlanta, which are among the fastest-growing Metropolitan areas with more than 5 million people in the high income world, housing remains affordable. As has been the case throughout the nine years of the Survey, the most affordable housing has been in Metropolitan areas with the more traditional liberal land-use policies that have been replaced by urban containment policies in many metropolitan areas.

Understanding and Dealing with the Problem

The issue driving housing affordability is not demand. It is a supply problem driven by the destruction of the competitive land supply by overzealous land regulation. Former Reserve Bank of New Zealand Gov. Donald Brash squarely cited the cause in his introduction to the 4th Annual Demographia International Housing Affordability Survey who said that the one issue separating markets with housing affordability from on affordable housing “is the severity of the artificial restraints on the availability of land for residential building.”

Hon. Bill English, Deputy Prime Minister of New Zealand, who is leading an effort to reform his nation’s destructive policies, describes the problem further in his introduction to this year’s Survey:

 It costs too much and takes too long to build a house in New Zealand. Land has been made artificially scarce by regulation that locks up land for development. This regulation has made land supply unresponsive to demand. When demand shocks occur, as they did in the mid-2000s in New Zealand and around the world, much of that shock translates to higher prices rather than more houses.

 Housing Affordability and a Sustainable Economy

There has been increasing attention to the challenging demographic trends that could materially reduce future standards of living. Birth rates have plummeted, while the share of the population that is elderly has increased substantially. As a result, government financial obligations could overwhelm the ability of nations to pay. Higher than necessary housing costs would make it even more difficult to meet these obligations.

Further, surveys indicate that many households are having children later, or not at all because housing conducive to raising children is unaffordable. There are generally lower fertility rates in urban cores, with their higher density housing than in the more dispersed suburbs, with their detached and semi-detached housing.

But the consequences of stagnant or declining standards of living and rising poverty could be even greater. Harvard economist Harvard economist Benjamin Friedman concluded that continuing improvements in the quality of life are required for social sustainability, in his The Moral Consequences of Economic Growth.

Affordable housing is thus a critical component of economic sustainability. Yet, the “conventional wisdom” in land-use policy favors urban containment strategies that severely ration land for development, materially raising its price.

There are indications that perspectives are changing. New York University Professor Shlomo Angel writes in his book Planet of Cities of the importance of housing affordability and argues against  urban planning restrictions that restricting adequate housing to ordinary households.

A team of UK academic researchers has questioned the appropriateness of assuming that urban containment should be the default land use option. This is an important development, since much of urban planning is committed to outlawing more liberal land-use policies.

Urban policy needs a “reset.” The emphasis should be shifted away from “designing” urban areas to facilitating a better standard of living for the people who live in them. In his epic Civilization: The West and the Rest, historian Niall Ferguson, in his Civilization notes that “The success of the civilization is measured not just in its aesthetic achievements but also, and surely more importantly in the duration and quality of life of its citizens.” This requires greater affluence and less poverty, both of which require more affordable housing.

The Atlanta Transit Tax: For the 1 Percent


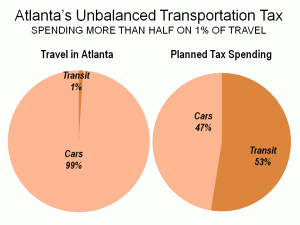
Voters in Atlanta, with some of the worst traffic congestion in the nation, are being asked to approve a new tax that would spend more than 50% on transit, in an urban area where transit carries only 1% of travel (Figure). No one is naive enough to think that the new billions for transit would improve traffic congestion. Worse, the distorted program would contribute to worse congestion by spending on billions on transit, which cannot reduce traffic congestion, instead of on roadways, which is the only way that traffic congestion can be reduced.

The July 31 vote is in 10 counties of the 28 county Atlanta metropolitan area. The measure would raise the sales tax by one cent, for $8 billion in transit and highway projects over 10 years.

In a metropolitan area in which barely one percent of travel is by transit, the tax measure would devote more than one-half of the funding to transit (see Figure).  As we wrote in an Atlanta Journal-Constitution commentary, the focus of any transportation revenue issue should be on reducing travel times, whether by transit or highways. This is how transportation improves an urban economy. The reality is that with nearly all travel by highways and transit’s inherently slower travel times, much of the tax money would be spent on strategies that have virtually no hope of reducing travel times or traffic congestion.

Atlanta’s Traffic Congestion: Promoters of the tax claim that the highway projects will reduce traffic congestion. Atlanta is well known for its serious traffic congestion. There are two reasons for this:

(1) Atlanta has a sparse freeway system, which is limited to little more than a belt route (I-285) and three radial freeways (I-20, I-75 and I-85) that converge into two downtown. Seven years ago, we rated Atlanta as having the least effective freeway system among major US urban areas. Nothing has happened to change that rating, except for the addition of 750,000 people. This tax issue will do virtually nothing to improve roadway travel on the regional level.

(2) Perhaps even worse, Atlanta’s regional arterial (high capacity streets) system is virtually non-existent. For this reason, we proposed (in 2000) development of a one-mile terrain constrained grid of arterials . A local editorial writer found this so hard to deal with it that he misrepresented it as a mile grid of freeways to make it look extreme. Later, the Atlanta Regional Council (ARC), the local metropolitan planning organization, included a somewhat more modest (but useful) arterial grid in is regional plan.

The Transit Tax: Fixing What Should have Already Been Fixed: The transit projects have virtually no potential to reduce work trip travel times and thus no potential to reduce traffic congestion. Approximately one-fifth of the transit funding would be used to rehabilitate and upgrade the MARTA subway system, a need that should have been legitimately funded from the existing MARTA sales tax.

The Transit Tax: Subsidizing Land Speculation: Another nearly 20 percent of the transit funding would be spent on the “Belt-Line” streetcar project in central Atlanta. The Belt-Line is more “city building” (read “real estate speculating”) than it is transportation. It will do nothing to reduce work trip travel times. Further, it is exceedingly costly. The extravagance of this project is illustrated by an annualized capital cost alone (principally construction) high enough to pay the lease on a new mid-sized car for each new regular passenger.

The Transit Tax: Emulating Miami? The history of transit is fraught with cost increases and project cancellation and delay as transit agencies, unable to control their rising costs, can spend money for day-to-day operations that had been planned to build new transit lines. This has happened with a vengeance in Miami, where a 2002 transit tax to expand the rail system has largely been frittered away in higher operating costs. It could happen in Atlanta.

The Road Projects: In a metropolitan area in which personal mobility predominates, roadway improvements, such as expansions, an arterial grid in Atlanta’s case and completion of the GA-DOT HOT (high occupancy toll) system provide the greatest potential for reducing travel times. There is another significant benefit to highway investments. As traffic speeds increase fuel efficiency improves and both air pollution and greenhouse gas emissions are reduced.

With less than 50 percent of the funding going to roads, less than one-half the potential benefit of the $8 billion can be achieved. This ineffective return is felt by low income citizens almost to the same extent as everyone else. While 88 percent of all commuters in Atlanta travel by car, the figure is only slightly less (83 percent) among low income commuters (Figure 4).

What’s Right About Atlanta: For all its problems, Atlanta has much to be proud of. Former World Bank principal planner Alain Bertaud said of Atlanta in a 2002 study:

 While income and population were rising very fast, Atlanta managed to keep a very low cost of living. A worldwide cost of living survey conducted by the Economist Intelligence Unit in 2002 found that Atlanta had the lowest cost of living among major US cities and ranked 63rdamong major cities around the world. This achievement is remarkable in view of the rapid rate of growth of the metropolitan area over the last 20 years. It shows that while demographic and economic growth has certainly contributed to generate pollution and congestion, the various actors responsible for the management of metropolitan Atlanta must have done a lot of things right. High income growth and high demographic growth combined with a low cost of living suggests that labor markets are functioning well and that housing does not encounter important supply bottlenecks. (Note on Atlanta’s Superior Housing Affordabilitiy)

 Atlanta’s leadership should go back to the drawing board. A rational proposal is required to reduce Atlanta’s travel times (which are longer than its major US competitors, such as Dallas-Fort Worth and Houston) and grow the economy. There’s no point in spending more than 50 percent on the 1 percent.

(More at The Atlanta Transportation Tax: Too Much for Too Little.)


——

Note on Atlanta’s Superior Housing Affordability: Atlanta was most affordable major metropolitan area in the US, UK, Canada, Australia, Ireland, New Zealand and Hong Kong in the 8th Annual Demographia International Housing Affordability Survey.


Smart Growth on Steriods: Sick Cities

Smart growth on steroids, or the radical densification policy of California,  was the subject of my recent commentary in The Wall Street Journal — “California Declares War on Suburbia”  (http://online.wsj.com/article/SB10001424052702303302504577323353434618474.html?mod=rss_com_mostcommentart). Regional transportation plans in the San Francisco Bay Area, the Los Angeles area and the San Diego area seek to force the vast majority of new residents in future decades into multi-family housing. Under the state’s greenhouse gas emissions reduction law (Assembly Bill 32) and its companion urban planning law (Senate Bill 375), it will be nearly impossible to build new detached housing. This is despite the fact that 80 percent additions to the housing stock in California’s major metropolitan areas was detached between 2000 and 2010.

It was bad enough when misnamed “smart-growth” policies simply sought to ban building beyond the urban fringe (where the city meets the country). The result was as predictable as the effects of an OPEC oil embargo. When developable land is embargoed, its price goes up. How much it goes up is anyone’s guess, because prices cannot be accurately predicted in a manipulated market. In the case of oil, it can be expected that speculators will enter the market seeking a quick profit. It is no different in residential land (and housing), where the was much more speculative activity in the bubble states of California, Florida, Arizona and Nevada (so designated by New York Federal Reserve Bank reserve), and of course there were substantial house price increases.

The amazing thing about this is that underlying housing demand was low in the worst of the bubble states, California. During the bubble, more than 1,000,000 residents moved to other states (California kept growing because of immigration and the excess of births over deaths). By comparison, in Atlanta, Dallas-Fort Worth and Houston (and for that matter Indianapolis, Columbus and Kansas City), there was net immigration, yet housing prices stayed within historic norms. By the time the peak hit, prices in California metropolitan areas were from double to nearly quadruple historic norms.

Now, however, the urban planners want to limit construction to areas that are close to rapid transit stops, and at densities five or more times consumer preferences. Rather than quarter or fifth of an acre lots, planners intend that nearly all new housing will be at 20, 30 or even 40 to the acre. Naively, they assume that this will encourage people to use transit more. Yet, even their own plans don’t show any such impact. In San Diego, the share of travel on transit would rise from less than 2 percent now to less than 4 percent in 2050, despite spending more than half of the highway and transit money on transit. Thus, spending up to 25 times transit’s share of the market returns only the most modest transit ridership increases.

The higher densities are likely to lead to more intense traffic congestion, consistent with the association between high densities and intense traffic congestion around the world. The irony is that the higher the share of travel on transit, the worse the traffic congestion. This is because transit ridership is high only where there is high density, but the transit use does not reduce demand enough to compensate for the larger density of cars.

Urban areas are justified by economics. People have moved to them to have better lives. Raising the price of housing (unnecessarily) and slowing down commuting (because transit is much slower) could work against urban areas that implement such policies and drive people elsewhere. This is evident, already, in the San Francisco Bay area, Los Angeles and San Diego, where growth has slowed to a trickle — places where the net-outmigration is greater even than that of former migration laggards Pittsburgh and St. Louis.

—–

Also see: California Declares War on Suburbia II: The Cost of Radical Densification

http://www.newgeography.com/content/002781-california-declares-war-suburbia-ii-the-cost-radical-densification

Preserving the Ideal of a Property Owning Democracy: The 8th Annual Demographia International Housing Affordability Survey

www.dhi.pdf


EXECUTIVE SUMMARY

Rating Housing Affordability

The 8th Annual Demographia International Housing Affordability Survey covers 325 metropolitan markets in Australia, Canada, Hong Kong, Ireland, New Zealand, the United Kingdom and the United States. The Demographia International Housing Affordability Survey employs the “Median Multiple” (median house price divided by gross [before tax] annual median household income) to rate housing affordability (Table ES-1). The Median Multiple is widely used for evaluating urban markets, and has been recommended by the World Bank and the United Nations and is used by the Harvard University Joint Center on Housing.


More elaborate indicators, which mix housing affordability and mortgage affordability can mask the structural elements of house pricing are often not well understood outside the financial sector. Moreover, they provide only a “snapshot,” because interest rates can vary over the term of a mortgage; however the price paid for the house does not. The reality is that, if house prices double or triple relative to incomes, as has occurred in many severely unaffordable markets, mortgage payments will also be double or triple, whatever the interest rate.

Historically, the Median Multiple has been remarkably similar in Australia, Canada, Ireland, New Zealand, the United Kingdom and the United States, with median house prices having generally been from 2.0 to 3.0 times median household incomes (historical data has not been identified for Hong Kong), with 3.0 being the outer bound of affordability. This affordability relationship continues in many housing markets of the United States and Canada. However, the Median Multiple has escalated sharply in the past decade in Australia, Ireland, New Zealand, and the United Kingdom and in some markets of Canada and the United States.

The Demographia International Housing Affordability Survey is produced to contrast the deterioration in housing affordability in some metropolitan markets with the preservation of affordability in other metropolitan areas. It is dedicated to younger generations who have right to expect they will live as well or better than their parents, but may not, in large part due to the higher cost of housing.

Housing Affordability in 2011

Housing affordability was little changed in 2011, with the most affordable markets being in the United States, Canada and Ireland. The United Kingdom, Australia and New Zealand continue to experience pervasive unaffordability.

Major Metropolitan Markets: The 325 markets include 81 major metropolitan markets (those with more than 1,000,000 population).

Among these major metropolitan markets, there were 24 affordable major markets, 20 moderately unaffordable major markets, 13 seriously unaffordable major markets and 24 severely unaffordable major markets. All of the affordable major markets were in the United States while three of the moderately unaffordable markets were in Canada and one in Ireland with the other 16 in the United States. The severely unaffordable major markets were principally in the United Kingdom (8), the United States (6), and Australia (5). Hong Kong was severely unaffordable and there were three severely unaffordable major markets in Canada and one in New Zealand (Table ES-2).


The most affordable major market was Detroit, with a Median Multiple of 1.4, below the historic range of 2.0 to 3.0. Atlanta had a Median Multiple of 1.9. The other 22 affordable major markets had Median Multiples of from 2.0 to 3.0, with the most affordable being Phoenix, Rochester, Cincinnati, Cleveland and Las Vegas. The strong growth markets of Dallas-Fort Worth, Houston, Orlando, Jacksonville, Nashville, Oklahoma City, Sacramento and Indianapolis also achieved affordable ratings.

All major markets in Australia and New Zealand, as well as Hong Kong were severely unaffordable. Hong Kong was the least affordable major market (ranked 81st), with a median multiple of 12.6. Vancouver was second most unaffordable, at a Median Multiple of 10.6 (ranked 80th), which is even more severely unaffordable than last year. Sydney was the third most unaffordable, at 9.2 (ranked 79th). Melbourne and Plymouth & Devon all had Median Multiples of more than 7.0.

All Markets: Among all 325 markets surveyed, there were 128 affordable markets, 117 in the United States, 9 in Canada and 2 in Ireland. There were 87 moderately unaffordable markets, 64 in the United States, 19 in Canada, 3 in Ireland and 1 in the United Kingdom. There were 39 seriously unaffordable markets and 71 severely unaffordable markets. Australia had 25 severely unaffordable markets, followed by the United Kingdom with 20 and the United States with 14. Canada had 6 severely unaffordable markets, while New Zealand had 5. China’s one included market, Hong Kong, was also severely unaffordable (Table ES-3). Honolulu and Bournemouth & Dorsett were the most unaffordable markets outside the major metropolitan markets, with a Median Multiple of 8.7.

Housing Affordability: Incompatible with Restrictive Regulation

The deterioration of housing affordability in many of the markets rated in the Demographia International Housing Affordability Survey is unprecedented based upon the available historical data. Australia and New Zealand, for example, which had legendary housing affordability from after World War II to the 1980s and 1990s have seen house prices reach levels that are nearly double even nearly triple their historic ratio to household incomes.

The economic evidence indicates that this trend is strongly related to the implementation of more restrictive land use regulations, especially measures that create scarcity in land for housing. In creating scarcity, more restrictive land regulation increases land prices, which increases house prices. In considering this process, economist Anthony Downs, of The Brookings Institution in Washington. D.C., has indicated the importance of maintaining the “principle of competitive land supply.” This is particularly important because one of the most favored more restrictive land use policies is the “urban growth boundary,” which prohibits development on considerable amounts of land that would otherwise be developable, resulting in artificial and unnecessary scarcity values. The escalation of house prices relative to incomes, from Sydney and Vancouver to London and across California testify to the failure of planning to maintain a competitive land supply. The record shows that smart growth (urban consolidation and compact cities policies) is incompatible with housing affordability.

More restrictive regulation has led to situations where “across the road” values per hectare of raw, developable land vary by more than 10 times in Auckland and Portland, based upon whether they are inside or outside the urban growth boundary. And these “urban echo values” at these locations (pricing in anticipation of future urban zoning) are generally substantially higher than the true rural values, further out from the urban growth boundary. Even larger differences have been documented in the United Kingdom’s Barker Report and researchers at the London School of Economics.

Further, economic analyses have indicated that metropolitan areas with more restrictive land use regulation tend to perform less well economically than would have been otherwise expected.

Preserving the “Ideal of a Property Owning Democracy”

One of the principal accomplishments of high-income world societies has been the expansion of property ownership and home ownership to the majority of the population. At the same time, there are dark economic clouds on the horizon. Governments in high income nations are faced with some of the most challenging times in their history. In this environment, the property owning middle-class seems likely to have to face significant challenges in the longer run. Housing represents the largest share of household budgets and thus, housing affordability is a major determinant of both the cost of living and the standard of living.

There are important positive signs. The state of Florida repealed its more restrictive regulations (“smart growth” law) in 2011. A major report released in December 2011 in New Zealand documented the importance of a competitive land supply in restoring housing affordability to that nation.

These are important first steps. There are serious social risks to more restrictive regulation and unnecessarily denying households the opportunity to own their own homes. In writing on the issue 40 years ago, urbanologist Peter Hall expressed concern about the effect of such policies on the “ideal of a property owning democracy.”