Author Archive

Sydney to Abandon Radical Smart Growth Policy

Australia’s New South Wales state government has proposed a new Metropolitan Strategy for the Sydney area which would significantly weaken its highly restrictive smart growth policy (also called urban containment, smart growth, livability, growth management, densification, etc.) that has driven if house prices to among the highest in the affluent New World (Australia, Canada, New Zealand and the United States) relative to household incomes.

According to the Australian Financial Review, the Liberal-National government plans to allow the building of more than 170,000 new homes, with the vast majority being on greenfield sites, largely beyond the current urban footprint. Premier Barry O’Farrell and his party had promised in their electoral campaign in 2011 to liberalize land-use regulation and to moderate the previous Labor government’s quota that required 70% of new houses to be built within the current urban footprint and 30% on greenfield sites. In fact, however, under the Labor government’s administration, new house building had been produced at a well below demand level.

Among the major New World metropolitan areas rated in annual Demographia International Housing Affordability Surveys, Sydney has been the most unaffordable, along with Vancouver, in recent years. Sydney and Vancouver have had among the most stringent urban containment policies in the New World, and the resulting unaffordable house prices under such circumstances are consistent with economic principle.

Premier O’Farrell told the Sydney Morning Herald said the government wanted to “make home ownership a reality again” He continued “The more blocks of land (lots) we can release, the greater downward pressure we can put on housing because it’s been so high for so long.” In a press release issued by his office, the Premier recalled that ” Before the election, I said I wanted to ensure owning a home wasn’t a fading dream for young families” and noted that the massive housing package “will go a long way to delivering on that commitment.”

In the longer run (by 2031), the government intends to provide for a total of 545,000 new homes, while abandoning the practice of allocating locations based upon planning theory. The overwhelming majority of these homes are likely to be built in greenfield areas on or beyond the urban fringe, rather than in urban infill.

Planning and Infrastructure Minister Bradley Hazzard told the Sydney Morning Herald that the government intended to “‘look further afield” then the presently planned greenfield suburban growth centers. He continued: “‘We’re trying to [be] less constrictive and restrictive and what we’re saying is the marketplace should have far more of a say in what the mix of housing is and where it should be,” adding that ”it doesn’t matter” what percentage was delivered in greenfield and established suburbs. He concluded: ”No one should be preoccupied by particular prescriptive formulas.”

The government also indicated its intention to encourage one half of employment growth over the next 20 years to be in Western Sydney. Western Sydney is virtually across the urban area from the central business district. This dispersion of employment, along with roadway improvements in the area are likely to improve the metropolitan balance between jobs and housing.

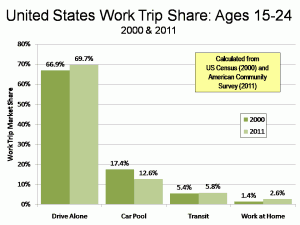
The plan for greater job dispersion would, if successful, bring Sydney more into line with urban best practices, which are exhibited by the location of most new jobs in edge cities, as well as throughout the entire urban area. Sydney has among the longest work trip travel times in the New World. The one-way work trip travel time is newly reported in the Metropolitan Strategy to have reached 35 minutes. Work trip travel times are worse only in Melbourne, at 36 minutes. By comparison, Dallas-Fort Worth, with a larger population, a much lower urban area density and a mere fraction of the Melbourne or Sydney transit work trip market share has a far shorter one-way work trip travel time (26 minutes).

The Sydney developments are the latest in a trend toward liberalizing urban land use in four nations.

In October, the New Zealand government announced plans to liberalize land-use amid growing concern about the extent to which that nation’s urban containment policies have destroyed housing affordability. In the introduction to the 9th Annual Demographia International Housing Affordability Survey, Deputy Premier Bill English said:

 Land has been made artificially scarce by regulation that locks up land for development. This regulation has made land supply unresponsive to demand. When demand shocks occur, as they did in the mid-2000s in New Zealand and around the world, much of that shock translates to higher prices rather than more houses.

 Recent polling has shown support, by an almost 2 to 1 margin for government action to improve housing affordability, with even higher stronger support in the 18 to 34 age group, where the margin was more than 3 to 1.

The United Kingdom Cameron government is also embarked on a program to liberalize that nation’s restrictive land use policies, which former Bank of England Monetary Policy Committee member Kate Barker found to be the cause of severe housing unaffordability in a report commissioned by the Blair Labour government. Planning Minister Nick Boles has characterized the unaffordability of housing as “the biggest social justice problem we have.”

In 2011, Florida repealed its statewide smart growth mandate and closed the administrative bureaucracy that had overseen the program. Before that, the government of the Australian state of Victoria substantially expanded the urban growth boundary of the Melbourne urban area.

Adapted from an article at newgeography.com


Smart Growth/Urban Containment Continue to Drive Unaffordable Housing in 7 Nations

We have just released the 9th Annual Demographia International Housing Affordability Survey covering 337 metropolitan markets in Australia, Canada, China (Hong Kong), Ireland, New Zealand, the United Kingdom and the United States. As usual, the most unaffordable markets are those in with urban containment policy (also called by other names, such as smart growth and compact cities policy). The Survey uses the Median Multiple to evaluate housing affordability.

The Demographia International Housing Affordability Survey employs the “Median Multiple” (median house price divided by gross before tax annual median household income) to rate housing affordability (Table 1). The Median Multiple is widely used for evaluating urban markets, and has been recommended by the World Bank and the United Nations and is used by the Harvard University Joint Center on Housing.

Historically, among the metropolitan areas outside Hong Kong, the Median Multiple was typically at 3.0 or below, before the adoption of urban containment policies. Urban containment policies ration land for development, and as economics would predict, this raises the price of land and thus the price of housing.

Severely Unaffordable Major Markets

The most unaffordable major markets (over 1,000,000 population) are Hong Kong, with a Median Multiple of 13.5, Vancouver with a median multiple of 9.5 and Sydney with a median multiple of 8.3 (Table 2).


The most severely unaffordable US major markets (over 1 million population) are San Jose, at 7.9, San Francisco, at 7.8, San Diego, 6.4, New York, 6.2, Los Angeles, 6.2, and Boston, 5.1. Each of these markets experienced a substantial house price escalation during the housing bubble and a substantial loss in house prices when the bubble burst.

In Canada, both Toronto (5.9) and Montréal 5.1 were rated severely unaffordable, in addition to Vancouver.

All major markets in land rich Australia are rated severely unaffordable, including Sydney (9.3), Melbourne (7.5), Brisbane (5.8) , Perth (5.9) and slow-growing Adelaide (6.5). New Zealand’s only major market, Auckland is also rated severely unaffordable, at 6.7

Among metropolitan areas with less than 1 million population, Honolulu was the most unaffordable in the seven nations, at 9.3.

In the United Kingdom, London (7.8), the London exurbs (6.8), Plymouth (7.3), Bristol (5.7), economically depressed Liverpool (5.3), economically depressed Newcastle (5.2), Birmingham (5.1) and Sheffield (5.1) were also rated severely unaffordable.

Affordable Markets

At the same time, affordable markets remain, even in the metropolitan areas with the highest growth rates. For example, Dallas-Fort Worth, Houston and Atlanta, which are among the fastest-growing Metropolitan areas with more than 5 million people in the high income world, housing remains affordable. As has been the case throughout the nine years of the Survey, the most affordable housing has been in Metropolitan areas with the more traditional liberal land-use policies that have been replaced by urban containment policies in many metropolitan areas.

Understanding and Dealing with the Problem

The issue driving housing affordability is not demand. It is a supply problem driven by the destruction of the competitive land supply by overzealous land regulation. Former Reserve Bank of New Zealand Gov. Donald Brash squarely cited the cause in his introduction to the 4th Annual Demographia International Housing Affordability Survey who said that the one issue separating markets with housing affordability from on affordable housing “is the severity of the artificial restraints on the availability of land for residential building.”

Hon. Bill English, Deputy Prime Minister of New Zealand, who is leading an effort to reform his nation’s destructive policies, describes the problem further in his introduction to this year’s Survey:

 It costs too much and takes too long to build a house in New Zealand. Land has been made artificially scarce by regulation that locks up land for development. This regulation has made land supply unresponsive to demand. When demand shocks occur, as they did in the mid-2000s in New Zealand and around the world, much of that shock translates to higher prices rather than more houses.

 Housing Affordability and a Sustainable Economy

There has been increasing attention to the challenging demographic trends that could materially reduce future standards of living. Birth rates have plummeted, while the share of the population that is elderly has increased substantially. As a result, government financial obligations could overwhelm the ability of nations to pay. Higher than necessary housing costs would make it even more difficult to meet these obligations.

Further, surveys indicate that many households are having children later, or not at all because housing conducive to raising children is unaffordable. There are generally lower fertility rates in urban cores, with their higher density housing than in the more dispersed suburbs, with their detached and semi-detached housing.

But the consequences of stagnant or declining standards of living and rising poverty could be even greater. Harvard economist Harvard economist Benjamin Friedman concluded that continuing improvements in the quality of life are required for social sustainability, in his The Moral Consequences of Economic Growth.

Affordable housing is thus a critical component of economic sustainability. Yet, the “conventional wisdom” in land-use policy favors urban containment strategies that severely ration land for development, materially raising its price.

There are indications that perspectives are changing. New York University Professor Shlomo Angel writes in his book Planet of Cities of the importance of housing affordability and argues against  urban planning restrictions that restricting adequate housing to ordinary households.

A team of UK academic researchers has questioned the appropriateness of assuming that urban containment should be the default land use option. This is an important development, since much of urban planning is committed to outlawing more liberal land-use policies.

Urban policy needs a “reset.” The emphasis should be shifted away from “designing” urban areas to facilitating a better standard of living for the people who live in them. In his epic Civilization: The West and the Rest, historian Niall Ferguson, in his Civilization notes that “The success of the civilization is measured not just in its aesthetic achievements but also, and surely more importantly in the duration and quality of life of its citizens.” This requires greater affluence and less poverty, both of which require more affordable housing.

Romantic Transit in Dallas (and San Antonio)

Friday’s San Antonio Express-News commentary (“Streetcars will please San Antonians once they are running”) by Garl Boyd Lantham, president of the Texas Association of Rail Passengers begins:

I still remember when, as a young child, my father first pointed out the dangers inherent with the misuse of statistical information. He told me that “an astute man could prove anything he wanted” with facts and figures, then proceeded to take the same collection of data and construct two reasonable but diametrically opposed arguments.

 All this came to mind when I read Randal O’Toole’s essay entitled “Subsidies make streetcars costly,” Other Views, Dec. 3. His column manufactured an artificial reality through the manipulation of facts.

 In full disclosure, please let me point out that I’m a railroad professional and a believer in rail-based initiatives. I have worked for companies like Amtrak and Dallas Area Rapid Transit, and am intimately familiar with passenger train operations of all types.

 O’Toole emphatically stated that San Antonians are “doomed to disappointment” if we re-establish street railway service. Nothing could be further from the truth.

 There’s no need to visit Portland, Ore. to see what streetcars (and other forms of rail-based passenger transportation) can do for a region, either. Our friends up in Dallas can offer all the lessons we need.

 Lantham is responding to Cato Institute senior fellow Randal O’Toole’s previous commentary (“Subsidies make streetcars costly”) criticizing the proposed San Antonio streetcar. There are two fundamental difficulties with Lantham’s commentary.

The first difficulty is that Lantham does not even attempt to show that O’Toole has mishandled any facts. This is, of course, not surprising, because after years of following O’Toole’s work, not a single instance comes to mind. Lantham’s quantitative criticism is profoundly unserious, given that the only number in his commentary is a date.

The second difficulty is that Lantham declares the Dallas rail system (DART) as a success based upon opinions, again without reference to a single number. The DART rail system was sold to local voters in the early 1980s as a means by which traffic congestion would be reduced (as virtually all rail systems are sold).

Here are some facts about Dallas has changed since the first DART rail line opened:

 1. Transit’s journey to work market share in Dallas County has fallen by one third, from  4.2 percent to 2.8 percent (US Census and American Community Survey data). Dallas County is the core county of the Dallas-Fort Worth metropolitan area and all DART rail lines, and the line to Fort Worth converge in downtown Dallas).

2. Transit has become less important in the larger Dallas-Fort Worth metropolitan area, having dropped 41 percent from a 2.4 percent work trip market share in 1990 to 1.4 percent in 2010.

3. DART’s light rail system has more than tripled in length since 2001. Yet, overall DART light rail and bus ridership was down from 2001 to 2011.

4. Traffic volumes in Dallas-Fort Worth have increased many times total transit ridership since before the first light rail line opened, and traffic congestion has risen by 65 percent.

Advocates of transit spending rarely, if ever, concern themselves about such dismal results. But if the purpose of spending money on urban rail is not to reduce traffic congestion, or to increase transit market shares, then what is it?

Lantham may provide the answer:

 Trains of all types are neat and fun and “sexy,”

 I agree. Trains are fun. I used to drive 10 miles one-way in the opposite direction to Simi Valley to catch the short-lived commuter train to downtown Los Angeles in the early 1980s (before the Chatsworth station was opened).

But “fun” and “sexy” are not responsibilities of  government. The substitution of romance for reality has led to misallocation of resources that has made traffic congestion worse in Dallas-Fort Worth. Even worse, irrational policy, driven at least in partially by romanticism, it is part of the reason that the nation (and many states) face a Fiscal Cliff.

Note: Dallas-Fort Worth: Characterized by Success

Despite the predictable failure of urban rail to transform Dallas County or Dallas-Fort Worth, the DFW Metroplex is one of the most successful metropolitan areas in the world. Workers in DFW have a work trip travel time of less than 26 minutes, according to the 2011 American Community Survey data. This is the shortest commute time of any metropolitan area with more than 5 million population in the first world. By comparison, in nearly equal sized Toronto, workers spend 33 minutes each way, despite a transit work trip market share more than 10 times as high and a population density nearly three times as high. Further, Dallas-Fort Worth (along with Atlanta and Houston) have the most affordable housing (relative to household incomes) among metropolitan areas over 5 million population in the high-income world.


Younger Adults Commuting More as Car Drivers

There has been considerable publicity to the effect that younger people are driving less than before. In fact, however, among the 16-25 age cohort, solo driving is up as a share of total work trips. According to the 2011 American Community Survey, the share of 16-25 year olds commuting alone by car was 69.6 percent, up from 66.9 percent as reported in 2000 (CTPP) data.

Transit commuting was also up, from 5.4 percent to 5.8 percent, mirroring the national increase for all ages from 4.6 percent to 5.0 percent. Working at home nearly doubled, with 2.6 percent of workers in the 16-25 age cohort working at home. Working at home is the most sustainable form of employment access, because it eliminates the work trip (see Figure).

There are various theories that may explain the surveyed reduction in overall travel by car among 16-25 year olds. Perhaps the most important factor is the near doubling in the unemployment rate for 16-25s. There is also the possibility that, as in commuting, virtual access is replacing travel as circles of friend become more identified though mobile phone and the internet than by physical access. This, of course, suggests greater efficiency, as younger people may be living more rewarding lives, while traveling less.


California’s Cap and Trade Slush Fund

It didn’t take long for California’s “cap and trade” program under AB 32 (the “Global Warming Solutions Act”) to deteriorate into just another slush fund for political officials to spend on their favorite projects. Of course, the purpose of cap and trade funds is to reduce greenhouse gas emissions. The state of California has adopted aggressive goals for such reductions, which will not be accomplished easily. Indeed, virtually all of the economic analysis of greenhouse gas emissions indicates that the most cost-effective strategies must be employed or the consequences likely to be serious economic harm – read higher poverty rates, fewer jobs and less discretionary income for households.

Governor Brown has already indicated an interest in using cap and trade funds to help build the first phase of the California high speed rail system, which has experienced the cost blowout of 200% compared to early 2000 projections, after adjustment for inflation. Further, California Air Resources Board Chair Mary Nichols told Business Week that high-speed rail would be a “legitimate” use of AB 32 cap and trade revenues.

The problem is that high-speed rail is not a cost-effective strategy for reducing greenhouse gas emissions. In 2008, Joseph Vranich and I authored a study for the Reason Foundation, The California High Speed Rail Proposal: A Due Diligence Report, which found that the minimum cost per ton of greenhouse gas reductions from the project would be nearly $2000, between 40 and 100 times the maximum range identified by the United Nations Intergovernmental Panel.

This estimate was based upon the cost and revenue projections of the California High Speed Rail Authority, which virtually every objective outside analyst found to be overly optimistic. History was to show the same. Today the project is much more costly than it was in 2008. Automobile fuel efficiency is projected to improve far more, which means much less will be saved in greenhouse gas emissions should a driver transfer from the car to the train. Finally, newer revenue projections are more modest, though still overestimated.

This may just be the beginning. The legislature and the Governor have approved legislation to commit 25 percent of the cap and trade revenues to “disadvantaged communities.” It is surprising that they have designated this and high speed rail as higher priorities than the purposes of AB32.

This is adapted from a commentary by the author in The Orange County Register (“Global Warming Bill Could Become Big Pork Barrel“)


Los Angeles Adds Rail, & $Billions, but Not Riders

Los Angeles County Supervisor Mark Ridley – Thomas talks glowingly of rail transit in Los Angeles in a recent Honolulu Star-Advertiser commentary. However, nowhere did he say that rail transit had reduced traffic congestion or increased transit ridership. There is a good reason for this — it did not happen.

It is useful to consider the Los Angeles rail experience in comparison with the promises and expectations that existed when it was created. I was present at the creation and played a major role in the establishment of the Los Angeles rail system.

Supervisor Ridley-Thomas represents the second district in Los Angeles County, which at one time was represented by Kenneth Hahn, a legendary fixture in Los Angeles governance for nearly 50 years. I had the pleasure of serving on the Los Angeles County Transportation Commission (LACTC) along with Supervisor Hahn, who I considered a good friend. LACTC was the top transportation policy authority in the nation’s largest county. I was appointed by Los Angeles Mayor Tom Bradley to three terms on LACTC, whose membership also included the five county supervisors, the Mayor of Los Angeles, the Los Angeles City Council President, the Mayor of Long Beach and two elected officials from smaller cities. I was the only private citizen on the LACTC, which was a predecessor of the Los Angeles MTA, the body on which Supervisor Ridley – Thomas serves.

I had become involved in transportation issues because of my belief that building a rail system in Los Angeles would reduce its intense traffic congestion. In August of 1980, Supervisor (and LACTC chair) Hahn called a special meeting to consider his proposal for reduced fare program to be financed by a countywide sales tax, which LACTC would place on the ballot under its legislative authority. Fearing the loss of the most important opportunity to bring rapid transit to Los Angeles, I took the initiative to confer with Supervisor Baxter Ward, a strong rail supporter, who agreed to second a motion to dedicate 35% of the funds to rail after a three year reduced fare period (Supervisor Ward’s amendment to set-aside a larger share had been previously defeated). My motion passed, and was incorporated into the “Proposition A” ballot issue, which provided nearly all the funding for the first light rail line and substantial amounts of funding for four additional lines. My motion was the genesis of the Los Angeles rail system.

Meanwhile, two subsequent taxes were approved by voters to provide funding for urban rail, since the escalating costs of the rail system rendered the Proposition A sales tax insufficient to keep the promises made by LACTC. At the beginning of 2011, five rail lines radiated from the urban core, with a sixth (cross-town) line in the inner suburbs.

It is well to step back and review the results. Many self-proclaimed transit advocates (more are actually advocates of transit funding, with little concern about generating more transit ridership) seem to mere require the running of shiny trains to prove the success of rail. In fact, rail can be justified only by the extent to which it cost effectively reduces traffic congestion and increases transit ridership. Based upon those practical standards, any objective analysis of rail transit in Los Angeles has to conclude that it has been an extravagant failure.

The hoped-for traffic congestion reduction did not occur. Not only that, transit ridership did not increase. Today, there are 7 percent fewer riders on the MTA bus and rail services then there were on buses alone in 1985. By contrast, over the period, the population of Los Angeles County grew by approximately 20 percent.

But while MTA ridership was falling, costs increased substantially. The latest National Transit Database information (2010) indicates that MTA’s daily operating costs have increased nearly one third since 1985, after adjustment for inflation. This is before considering the approximately $12 billion (in 2011$) of local, state and federal tax funding used to build the rail lines. Thus, now spending $300 million more annually and approximately $12 billion in construction and related expenses, transit ridership remains below the 1985 level. Los Angeles and the nation’s taxpayers have spent that much money and the effect is not even to “tread water” in transit ridership.

The number of daily work trip commuters carried on the MTA light rail and subway system is miniscule. The US Census Bureau’s American Community Survey data indicates that in 2011, approximately 20,000 daily one-way commuters used MTA’s six rail lines to get to work, little more than one-half of one percent of work trip commuting in Los Angeles County (3.6 million use cars daily to get to work).

At the same time, traffic volumes have increased substantially and travel speeds have declined. Since the first rail line opened in 1990, the average one-way work trip in Los Angeles County has increased nearly 3 minutes, from 26.5 minutes to 29.4 minutes in 2011.

By comparison, there has been a more than 100,000 increase in the number of people working at home (mostly telecommuting) since 1990 — five times the number of people commuting by rail. This increase in working at home has required virtually no tax funding, a stark contrast to the cost of rail.

The Los Angeles rail experience illustrates a fundamental difficulty in US and even international urban infrastructure policy. Too often, proponents confuse means and ends (objectives). Analysts often judge urban areas based upon issues such as the extent of rail transit systems. Yet, rail transit systems (and highways) are means, not objectives. Urban policy needs to focus on objectives. The purpose of urban areas is economic. People move to cities to improve their standard of living, not to ride trains, admire fountains or experience “good” urban planning. Perhaps the most important measure of an urban area’s performance is the amount of income households have left over after for the necessities of life, such as housing, food and, of course, taxes. Infrastructure is a means, but not the objective. It should be selected for its contribution to the objective of improving the standard of living of the urban area’s households.

—-

Note: This article is adapted from a column in the Hawaii Reporter.


Trulia Provides Sub-County Population Estimates: Suburban Areas Continue to Grow Faster

Jeb Kolko, Chief Economist of the real estate website firm, Trulia has provided the only believable sub-county population change data available for 2010 to 2011. In a Trulia website posting republished at newgeography.com (Even After the Housing Bust, Americans Still Love the Suburbs), Kolko shows that household growth was generally greater in less dense areas than in the more dense areas in 45 of the 50 largest metropolitan areas in the nation.

The Bureau of the senses had released sub-county population estimates earlier this year. Chris Briem of the University of Pittsburgh quickly pointed out that the estimates were nothing more than allocation of previously developed county level estimates to municipalities and other sub – county areas based upon their share of the 2010 population (See: Misreferencing Misoverestimated Population).  I followed up a couple of months later with additional analysis in an article entitled 2011 Census Sub-County Allocations Masquerade as Population Estimates (both articles appeared on newgeography.com).

Meanwhile, in view of the fact that federal statistical data should be beyond reproach, it is disappointing that the Bureau of the Census has not withdrawn the invalid 2011 sub – county population estimates.


Exaggerating Traffic Delays, but Not Taxpayer Risk: The Las Vegas XpressWest High Speed Rail Line

Large government financed infrastructure programs are often justified by promoters on the basis of apocalyptic delusions about the intolerable future that would face the public if the projects are not built. A case in point is the Victorville California to Las Vegas high-speed rail proposal, called “Xpress West” (formerly called “Desert Xpress”). Planning documentation alarmingly suggested that travel delays between Las Vegas and Los Angeles could reach seven hours in the next decade.

Nonetheless, supported by the hope of a subsidized interest rate loan of $5.5 billion or more from federal taxpayers, promoters continue to paint a picture of justification that does not stand up to scrutiny.

This is not to suggest there is not traffic congestion between Los Angeles and Las Vegas. The problem for this project is that virtually all the congestion on weekend travel between Los Angeles and Las Vegas occurs before Victorville, where it is assumed that people would leave their car to get on a train to finish the trip, instead of driving on to Las Vegas with little or no congestion. The return trip is somewhat different, with traffic congestion occurring between Las Vegas and Victorville.

We monitored traffic conditions and delays as reported by Google Maps on two recent weekends. These included Labor Day, one of the busiest holiday weekends, and the weekend following Labor Day.

Labor Day Weekend (August 31-September 3): On the Friday preceding Labor Day weekend (August 31), all of the traffic delays were between the Los Angeles area and Victorville, the section of the trip over which the train would not operate. Drivers experienced up to 61 minutes of delay between Los Angeles and the Victorville station location (Note 1). However, no delays were experienced between the Victorville station location and Las Vegas, the section of the trip over which the train would operate. Thus, if the train had been in operation, drivers not switching to the train would have encountered no traffic delays by staying in their cars.

As would be expected, on Monday Sept. 3, 2012, the last day of the Labor Day weekend, there were traffic delays between Las Vegas and the Victorville station location. The maximum delay reached nearly one hour, and delays exceeded 30 minutes for approximately seven hours.  In the worst case, a round trip driver would have avoided one hour of delay (30 minutes in each direction) by taking the train.

The Next Weekend (September 7-9): On the following two-day weekend, there was less traffic congestion between Los Angeles and Victorville. There were also delays of up to 10 minutes between Victorville and Las Vegas. A driver switching to the train would have lost more time by exiting the freeway and getting to the station than he would by continuing on the I-15 to Las Vegas.

Fewer travel delays were encountered on the Sunday return trip than on Labor Day weekend. The peak delay was 34 minutes, and 30 minute delays were exceeded for two hours (Figure 4). For a round-trip, a driver switching to the train in Victorville would have avoided, at most, 44 minutes or an average of 22 minutes in each direction.

Assessment: During the two recent weekends, from 87 percent to 100 percent of the traffic delay between Los Angeles and Las Vegas was encountered before reaching the Victorville station location. The train would do nothing to reduce this delay because the closest it reaches to Los Angeles is Victorville.

The minimal delays on, at most, two days per week are likely to fall short of attracting sufficient numbers of drivers for Xpress West to cover its costs, much less pay back the federal loan (if approved). A more detailed analysis will be found in our Reason Foundation “Xpress West” analysis. Among the most important findings were that (1) the planning assumptions for the train are based upon old, pre-recession data, (2) that ridership is unlikely to remotely reach the numbers projected by the promoters, (3) that huge losses are likely to occur, making it impossible to repay federal taxpayers.

A Solyndra-Style Loan Default Seems Likely: This could lead to a taxpayer loss of up to $6.5 billion, more than 10 times the amount taxpayers lost in the Solyndra bankruptcy.

Resources:

XpressWest: The XpressWest High-Speed Rail Line from Victorville to Las Vegas: A Taxpayer Risk Analysis

Las Vegas Monorail: Wendell Cox was also author of  ”Analysis of the Proposed Las Vegas LLC Monorail,” which indicated that ridership and revenue projections were extremely optimistic and that the project was likely to fail  financially. Subsequently the project filed bankruptcy and defaulted on bonds. The actual ridership on the Monorail was within the range predicted in “Analysis of the proposed Las Vegas LLC Monorail,” and far below the level forecast by project consultant URS Greiner Woodward Clyde. The Las Vegas Monorail case is described in the Reason Foundation report.

Notes:

(1) These estimates include a “congestion cushion,” which is additional time that people add to their planned travel times when they have tickets to travel on a scheduled transportation service, such as a train or a plane. This congestion cushion is added to expected travel times, which vary based upon expected traffic conditions by day and time of day.

(2) This article is adapted from articles posted at the Reason Foundation website. More information at The XpressWest Train to Las Vegas: Most Traffic Congestion Won’t Be AvoidedVirtually all of the traffic delays from Los Angeles to Las Vegas occur in areas the high-speed train won’t serve


America’s Love Affair with the Refrigerator

An article by Dan Neil in The Wall Street Journal takes the issue of driverless cars a bit further and concludes that it would make the nation more productive economically.

 The one brilliant part of the U.S. economic profile is productivity. It turns out, Americans are a little nutty when it comes to work.

 If autonomy were fully implemented today, there would be roughly 100 million Americans sitting in their cars and trucks tomorrow, by themselves, with time on their hands. It would be, from an economist’s point of view, the Pennsylvania oil fields of man-hours, a beautiful gusher, a bonanza of reverie washing upon our shores.

 The self-driving car is the next step in this process and promises to make our metropolitan areas even more productive by reducing traffic congestion, freeing more time for productive activity, reducing public expenditures on urban transport and improving safety.

Perhaps most importantly, Neil goes out of his way to put to rest the so-called American  “love affair with the automobile.” Americans and virtually all peoples around the world have similar love affairs — with convenience and better lives. Yet, we do not hear of their love affairs with refrigerators or televisions or smart phones. That’s because, among the plethora of modern conveniences that have enriched the lives of billions, the automobile has a special place as the Great Satan among those who believe they are anointed to be the the architects of other people’s lives.

For too long, superficial analysis has misled many to believe that there is a choice  not to drive. In fact, however, the automobile has been crucial in creating and supporting the huge and efficient labor markets that are large metropolitan areas. Access and mobility within them, and their attendant economic growth and poverty reduction, could have been achieved no other way with the technologies available. It is true that transit is unparalleled in the access it provides south of 59th street in Manhattan and in, at most, five other large central business districts (downtowns) in the United States. But for the 95 percent of work destinations outside these few places, the auto is usually the only alternative or takes half the time of any alternative (See: “Where Rail Works and Why, in The Road Less Understood). A similar story can be told about Paris, London, Toronto and the rest of Western Europe and Canada, where the automobile is king outside core areas that contain a minority of the metropolitan population.

The point was effectively made in a recent Washington Times editorial, entitled “A world without carsThe internal-combustion engine has freed mankind:”

 All it takes is a history book to envision the reality of a carless world, and it was a miserable time. Tailpipe emissions and the rumble of engines haven’t ruined modern city life; they’ve preserved it.

 ———-

Note: America’s Short Commute Times: One clarification is required. The Wall Street Journal article states that Americans have an average commute of 50 minutes. That is true. However, that is both ways combined. The average one-way work trip is about 25 minutes. This is an important point, since people ideologically opposed to the personal mobility and bereft of any understanding of its economic role have often talked as if average one-way commutes are much longer (one to two hours is not an unusual claim).

In fact, Americans have among the shortest commutes in the world. They spend less time going to and from work than people in Europe, affluent Asia and Canada. The data is in our Frontier Centre (Winnipeg) report on the competitiveness of metropolitan areas in Canada: http://www.fcpp.org/publication.php/4195


Mass Transit’s Limited Employment Access in the United States and Europe

There is a perception that mass transit is dominant in the metropolitan areas of Western Europe, unlike in the United States. In fact, in all metropolitan areas of Western Europe, as well as in the balance of the high income Western world, automobiles command the overwhelming majority of the motorized transport market share. European mass transit systems are more comprehensive than in the United States and they do provide greater access. However, as in the United States, transit is “about downtown,” in Europe. Automobile competitive transit services is only provided to the commercial cores and within the dense historical cores (which few US metropolitan areas have). Further, European metropolitan areas are increasingly polycentric or even dispersed in their travel patterns. For example, according to the International Union of Public Transport, (UITP, 2001), Western European urban areas have more than 80 percent of their employment outside the the central business districts. This compares to approximately 90 percent in the United States (Cox, 2006).

Research has been published in the United States that attempts to quantify metropolitan labor markets from the perspective of employees, generally following the research of Prud’homme and Lee (1998). Tomer, et al .(2011) quantify the share of metropolitan area jobs that can be reached by the average resident in each of the 100 largest metropolitan areas.

Tomer, et al.  developed access information for 45 minute commutes by mass transit. This data indicates that 6.3 percent of the jobs in the 51 metropolitan areas with more than 1 million population can be reached by the average resident in this time period. While no similar comprehensive studies of automobile access to employment have been identified, it appears likely that automobile access is far greater, because automobile speeds are much higher and automobiles are able to provide more proximate access at both the original and destination.

On the other hand, one of the strengths of the automobile is providing access to dispersed locations, from virtually every location in an metropolitan area to every other location. For most trips, the automobile will be faster than mass transit or any other alternative. Moreover, for a large number of trips, alternative mobility by mass transit is simply not available because one or both of the trip ends can be beyond walking distance from an access point (the “last mile” or “last kilometer” problem).

The “last kilometer” problem that makes mass transit uncompetitive with the automobile for most trips in the United States is also evident in Europe. According to Gerondeau, “there is now little alternative to the car for a great majority of trips.” Gerondeau (1999) indicates that no credible alternative exists for 80 percent of automobile travel in the Netherlands, despite its high density and large transit networks. Sieverts (2003) finds little potential for replacing automobile demand in Europe: “the diffuse character of urban areas does not lend itself to a conventional economic railway or bus operating offering a frequent enough service.”

The problem is also evident in the Paris area, which is generally considered to have one of the best mass transit systems in the affluent West. Residents of new towns served by the regional metro (“RER”) in suburban Paris can reach only one-half the employment in one-hour as those traveling by car, as indicated in the Table. (Fouchier & Michelon 1999).


Table

Paris New Towns: Automobile and Mass Transit Labor Markets

 New Town

Automobile Labor Market

Mass Transit Labor Market

Automobile Compared to Mass Transit

 Lieusaint Moissy

87%

26%

3.35

 Evry

86%

36%

2.39

 Cergy

73%

45%

1.62

 Saint Quentin en Yvelines

78%

49%

1.59

 Noisy-le-Grand

94%

48%

1.96

 Average

84%

41%

2.05

 Employment Accessibility within 60 Minutes (Ile-de-France)Source: Calculated from Fouchier.and Michelon, 1999.


REFERENCES

Cox, W. (2006), “Demographia United States Central Business Districts (Downtowns): 50 Largest Urban Areas 2000 Data on Employment & Transit Work Trips,” Demographia, http://www.demographia.com/db-cbd2000.pdf.

Fouchier V. & S. Michelon (1999), “Isochrones autour des villes nouvelles aux heures de pointe.”  DREIF & Groupe Central des Villes Nouvelles.

Gerondeau, C. (1997) Transport in Europe, Artech House.

Prud’homme, R. & Lee, C. (1998), “Size, Sprawl, Speed, and the Efficiency of Cities,” Obervatoire de l’économic et des Institutions Locals.

Tomer, A,  E. Kneebone,  A. Berube, & R. Puentes, R. (2011), “Missed Opportunity: Transit and Jobs in Metropolitan America,” Brookings Institution.

UITP (2001), “Millennium Cities Database,” http://www.uitp.org/publications/index2.cfm?id=5 (CD).