Category: Property Issues

Green Policies, Bad Results

We at the NCPA have for a number of years written about how public policies and private actions intended to protect the environment often end up causing environmental harm.  Such unintended consequences continue to this day.

We first warned of the misguided policies that harmed the natural environment in our national parks and national forests in 1986.  We followed up on those themes a number of times, most recently in 2007 in a study which, among other things, documented how failed federal forest management has resulted in the huge forest fires that have become so frequent in recent years.

The same study also showed how federal policies have encouraged overharvesting of ocean fish stocks lead to the near collapse of the ocean fisheries.

Another study examined how federal policies have resulted in environmental destruction on the nation’s coasts and farmlands and have encouraged the destruction of wetlands.

In addition, the NCPA has written extensively on how subsidies and mandates for green energy, including wind power and solar power result in a variety of environmental ills.

Now comes an odd story of how building energy efficiency upgrades – like the ones touted by President Obama during his recent State of the Union Address – can result in expensive unintended consequences.  It is fairly widely recognized that indoor air is up to five times more polluted than outdoor air.  And the more efficient the home, the worse the problem since efficient homes don’t let air flow from outside but rather recycle the same polluted air over and over.  Now a new problem, specifically with energy efficient windows has come to light.  In California journalists have confirmed and the National Association of Homebuilders is investigating the case of a Prius owner who have found parts of her car melted by the sunbeams reflected off of a neighboring condo’s energy efficient windows.  I’ve experience the ability of reflective windows to blind drivers on the highway, but I never worried about them melting my car.  Does insurance cover that?

Why Housing is So Expensive in Metropolitan Washington

Anyone familiar with housing affordability in the Washington (DC-VA-MD-WV) metropolitan area is aware that prices have risen strongly relative to incomes in the last decade

However, a recent Washington Post commentary by Roger K. Lewis both exaggerates the contribution of higher construction costs and misses the principal factor that has driven up the price of housing — more restrictive land-use regulations.

Lewis compares construction costs in the early 1970s to current costs and finds that they are approximately 6 times as high. In fact, however, when the R. S. Means construction cost index for locations in the metropolitan area are adjusted for inflation, the increase is more like 15% (1970 to 2007).

Lewis also indicates that construction costs have risen faster than the “relatively flat income curve.” In contrast, Census Bureau data indicate that median household incomes in the Washington metropolitan area have increased more than 30% since the early 1970s, after adjustment for inflation. House construction costs are the flatter of the two, not incomes.

While Lewis’ focus is affordable housing, costs in this low income sector are impacted by many of the same factors that drive overall housing affordability (overall house prices relative to incomes).

Lewis does not consider the huge cost increase in the non-construction costs of housing. In the Washington metropolitan area, we have estimated that the land and the regulatory costs for a new house have been driven to more than 5.5 times the level that would be expected in a normal regulatory environment (see the Demographia Residential Land & Regulation Cost Index). The problem is that the restrictive land-use policies, such as the Montgomery County agricultural reserve, similar regulations in other metropolitan area counties and the large lot building restrictions in Loudoun County have driven the price of land up substantially, and with it, the price of housing. We estimate that more restrictive land use regulations have driven the price of a new house up approximately $75,000.

Not surprisingly, Washington’s Median Multiple (median house price divided by median household income) remains more than a third above the 3.0 historic norm, at 4.0, even after the burst of the housing bubble. So long as governments in the Washington, DC area continue to strictly ration land for development, higher than necessary costs will continue to plague both housing affordability and affordable housing.

The Social Costs of Smart Growth (Urban Containment)

“Soaring” land and house prices “certainly represent the biggest single failure” of smart growth, which has contributed to an increase in prices that is unprecedented in history. While this finding could well have been from our NCPA Policy Report, The Housing Crash and Smart Growth, they were actually from one of the world’s leading urbanologists, Sir Peter Hall, in the classic work he led on urban containment planning (a principal strategy of smart growth) 40 years ago. Hall led an evaluation of the effects of the British Town and Country Planning Act of 1947 (The Containment of Urban England) between 1966 and 1971. The principal purpose of the Act had been urban containment, using the land rationing strategies of today’s smart growth, such as urban growth boundaries and comprehensive plans that forbid development on large swaths of land that would otherwise be developable.

The Economics of Urban Containment (Smart Growth): The findings of Hall and his colleagues were just the beginning. A Labour Government report in the mid-2000s showed that housing affordability had been even further retarded by the policies. The author, Kate Barker was a member of the Monetary Policy Committee of the Bank of England, which like America’s Federal Reserve Board, is in charge of monetary policy. Among other things, the Barker Reports on housing and land use found that urban containment had driven the price of land with “planning permission” to 250 times (per acre) that of comparable land on which planning was prohibited. Under normal circumstances comparable land would have similar value.

The economic research is by no means limited to Hall and Barker, rather it is overwhelming. From left to right, economists have shown stronger land use regulation tends to raise land (and thus house) prices. Just like water tends to run downhill, prices tend to rise when supply is restricted, all things being equal. This is why the world so nervously watches OPEC fearing the supply constraints that generate higher oil prices. Moreover, there can be no other reason for the price differentials virtually across the street that occur in smart growth areas. Dr. Arthur Grimes, Chairman of the Board of New Zealand’s central bank (the Reserve Bank of New Zealand), found the differential on either side of Auckland’s urban growth boundary at 10 times, while we found an 11 times difference in Portland across the urban growth boundary.

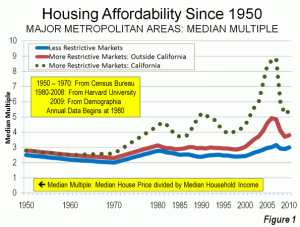
House Prices in America: The Historical Norm: Since World War II, median house prices in US metropolitan areas have generally been between 2.0 and 3.0 times median household incomes (a measure called the Median Multiple). This included California until 1970 (Figure 1). After that, housing became unaffordable in California, averaging nearly 1.5 times that of the rest of the nation during the 1980s and 1990s (adjusted for incomes). Even after the huge price declines from the peak of the bubble, house prices remain artificially high in Los Angeles, San Francisco, San Diego and San Jose, at double historic norms.

William Fischel of Dartmouth University examined a variety of justifications for the disproportionate rise of California housing prices and dismissed all but more restrictive land use regulation. He noted that “growth controls (restrictive land use regulations) have the undesirable effect of raising housing prices.” Throughout the rest of the nation, more restrictive land use regulations have been present in every market where house prices rose substantially above the historic Median Multiple norm, even during the housing bubble. No market without smart growth has ever reached these price heights.

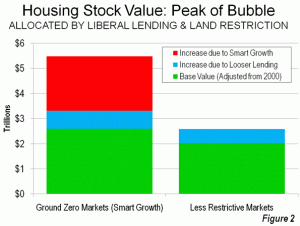
Setting Up for the Fall: Excessive Cost Increases in Smart Growth Markets: The Housing Crash and Smart Growth, published by the National Center for Policy Analysis, examined the causes of house price increase during the housing bubble. The analysis included all metropolitan areas with more than 1,000,000 population. It focused on 11 metropolitan areas in which the greatest cost increases occurred (the 11 “ground zero” markets, Los Angeles, San Francisco, San Diego, San Jose, Sacramento, Riverside – San Bernardino, Las Vegas, Phoenix, Tampa – St. Petersburg, Miami and the Washington, DC metropolitan areas), comparing them to cost increases in the 22 metropolitan areas with less restrictive land use regulation.

• Less Restrictively Regulated Markets: In the less restrictively regulated markets, the value of the housing stock rose approximately $560 billion, or 28 percent from 2000 to the peak of the bubble. In nearly all of these markets, the Median Multiple remained within the historical range of 2.0 to 3.0 and none approached the high Median Multiples that occurred in the “ground zero” markets.

• Ground Zero Markets The value of the housing stock rose $2.9 trillion from 2000 to the peak of the bubble in the “ground zero” markets, all of which have significant land use restrictions. The 112 percent increase in the “ground zero” markets was four times that of the less restrictively regulated markets. The Median Multiple rose to unprecedented levels in each of the “ground zero” markets, peaking at from 5.0 to more than 11.0, double to four times the historic norm.

The 28 percent increase in relative house value that occurred in the less restrictively regulated markets (those without smart growth) is attributed to the influence of loosened lending standards. The excess above 28 percent, which amounts to $2.2 in the “ground zero” markets is attributed to smart growth.

The underlying demand for housing was substantial in some of the less restrictively markets, which is illustrated by the strong net domestic migration to metropolitan areas such as Atlanta, Austin, Dallas – Fort Worth, Houston, Raleigh and San Antonio. At the same time, some more restrictive markets (smart growth) that hit historically experienced strong demand were experiencing huge domestic outmigration, indicating little in underlying demand. This includes Los Angeles, San Francisco, San Diego and San Jose. Demand, however is driven upward in more restrictively metropolitan areas by speculation which, according to the Federal Reserve Bank of Dallas is attracted by supply constraints.

The Fall: Smart Growth Losses

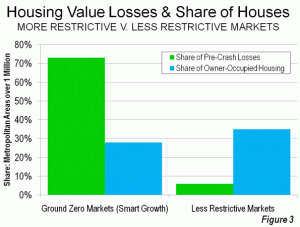
The largest house price drops occurred in the markets that had experienced the greatest cost escalation. This is not only to be expected from a perspective of probability, but is also indicative of the greater price volatility of more restrictively regulated markets as shown by economists Edward Glaeser and Joseph Gyourko. The “ground zero” markets, with only 28 percent of the owner occupied housing stock, accounted for 73 percent of the pre-crash losses ($1.8 trillion). Thus, much of the cause of the housing crash, which most analysts date from the Lehman Brothers bankruptcy (September 15, 2008), can be attributed to these 11 metropolitan areas.

By contrast, the 22 less restrictively regulated markets accounted for only six percent ($0.16 trillion) of the pre-crash losses. These 22 markets represented 35 percent of the owned housing stock (Figure 3).

If the losses in the ground zero markets had been limited to the rate in the less restrictively regulated markets (the estimated impact of cheap credit), lenders would have lost $1.6 trillion less. The Great Financial Crisis might not have been so “Great.”

Economic Denial and Acknowledgement: Dr. Hall noted that English planners denied the connection between the unprecedented house price increases and urban containment. The same economic denial is found among smart growth advocates today. This is perhaps to be expected, because, as Hall noted 40 years ago, an understanding of the longer term consequences could have undermined support for urban containment.

To their credit, some advocates recognize that smart growth raises house prices. The Costs of Sprawl – 2000¸ a volume largely sympathetic to smart growth, also indicates that urban containment strategies can raise housing prices. The only question is how much smart growth raises house prices. The presence of urban containment policy is the distinguishing characteristic of metropolitan markets where prices have escalated well beyond the historic norm.

The Social Costs of Smart Growth: Moreover, the social impacts of smart growth are by no means equitable. Peter Hall says that the “less affluent house – owner … has paid the greatest price for (urban) containment.” He continues: “there can be little doubt about the identity of the group that has got the poorest bargain. It is the really depressed class in the housing market: the poorer members of the privately – rented housing sector.” Finally, Hall laments the fact that the result contravenes the “ideal of a property owning democracy.”

Hall’s four decades old concern strikes a chord on this side of the Atlantic. Just last week, a New York Times/CBS News poll found that nine out of ten respondents associated property ownership in the form of a home with the American Dream.
Adapted from an article in newgeography.com

Smart Growth and Livability: The Road to More Intense Air Pollution and Traffic Congestion

Population Density and Air Pollution: For years, regional transportation plans, public officials, and urban planners have been seeking to densify urban areas, using strategies referred to as “smart growth” or “livability.” They have claimed that densifying urban areas would lead to lower levels of air pollution, principally because it is believed to reduce travel by car. In fact, however, EPA data show that higher population densities are strongly associated with higher levels of automobile travel and more concentrated air pollution emissions.

This is illustrated by county-level data for nitrogen oxides (NOx) emissions, which is an important contributor to ozone formation. This analysis includes the more than 425 counties in the nation’s major metropolitan areas (those with more than 1 million in population).

Seven of the 10 counties with the highest NOx emissions concentration (annual tons per square mile) in major metropolitan areas are also among the top 10 in population density (2008). New York County (Manhattan) has by far the most intense NOx emissions and is also by far the most dense. Manhattan also has the highest concentration of emissions for the other criteria air pollutants, such as carbon monoxide, particulates, and volatile organic compounds (2002 data). New York City’s other three most urban counties (Bronx, Kings, and Queens) are more dense than any county in the nation outside Manhattan, and all are among the top 10 in NOx emission density.

Traffic and Air Pollution: More concentrated traffic also leads to greater traffic congestion and more intense air pollution. The data for traffic concentration is similar to population density.[7] Manhattan has by far the greatest miles of road travel per square mile of any county. Again, seven of the 10 counties with the greatest density of traffic are also among the 10 with the highest population densities. As in the case of NOx emissions, the other three highly urbanized New York City counties are also among the top 10 in the density of motor vehicle travel.

There is a significant increase in the concentration of both NOx emissions and motor vehicle travel in each higher category of population density. For example, the counties with more than 20,000 people per square mile have NOx emission concentrations 14 times those of the average county in these metropolitan areas, and motor vehicle travel is 22 times the average. All of this is consistent with research by the Sierra Club and a model derived from that research by ICLEI–Local Governments for Sustainability, both strong supporters of densification, show that traffic volumes increase with density.

Public Health: These data strongly indicate that the densification strategies associated with smart growth and livability are likely to worsen the concentration of both NOx emissions and motor vehicle travel. But there is a more important impact. A principal reason for regulating air pollution from highway vehicles is to minimize public health risks. Any public policy that tends to increase air pollution intensities will work against the very purpose of air pollution regulation—better public health. The American Heart Association found that air pollution levels vary significantly in urban areas and that people who live close to highly congested roadways are exposed to greater health risks. The EPA also notes that NOx emissions are higher near busy roadways. The bottom line is that—all things being equal—higher population density, more intense traffic congestion, and higher concentrations of air pollution go together.

All of this could have serious consequences as the EPA expands the strength of its misguided regulations. For example, officials in the Tampa–St. Petersburg area have expressed concern that the metropolitan area will not meet the new standards, and they have proposed densification as a solution, consistent with the misleading conventional wisdom. The reality is that this is likely to make things worse, not better. Officials there and elsewhere need to be aware of how densification worsens air pollution intensity and health risks and actually defeats efforts to meet federal standards.

Growth That Makes Areas Less Livable:
There are myriad difficulties with smart growth and livability policies, including their association with higher housing prices, a higher cost of living, muted economic growth, and decreased mobility and access to jobs in metropolitan areas. As the EPA data show, the densification policies of smart growth and livability also make air pollution worse for people at risk, while increasing traffic congestion.

Additional details will be found at Wendell Cox, ” Population Density, Traffic Density and Nitrogen Oxides (NOx) Emission Air Pollution Density in Major Metropolitan Areas of the United States,” http://www.demographia.com/db-countynox.pdf.

This article is adapted from a Heritage Foundation web memo (http://www.heritage.org/research/reports/2011/09/how-smart-growth-and-livability-intensify-air-pollution)