Tag: "Air Pollution"

EPA Testing Seems At Odds With Public Statements

“Call us for more information and to see if you qualify!”

What exciting opportunity might this be? How about the chance to be exposed to toxins that the researchers say can cause death.

Indeed, this cheery offer came from a set of flyers printed by the EPA seeking human testing subjects for air pollution experiments.

According to an EPA Inspector General report, during five studies conducted in 2010 and 2011, the EPA conducted experiments on 81 individuals, exposing them to airborne particles known as PM2.5 (basically, soot and dust), diesel exhaust, and ozone. Some test subjects experienced cardiac arrhythmias during the testing, and one woman, with a history of medical problems, was sent to the hospital.

The report describes the five air quality studies, expressing concern that the agency exposed a research subject above the study’s concentration targets and that the EPA’s consent forms did not address all of the risks (including death) surrounding pollutant exposure.

Moreover, only one of the studies’ consent forms “identified the upper range of pollutant exposure for each study subject.” The other four consent forms “did not mention the level of pollutant exposure. Instead, the forms…compared the subject’s level of exposure during the study to the exposure they would receive visiting major cities on smoggy days.”

Why was this info left out? The EPA justified its “smoggy days” description of the study because a study manager “explained that a person breathing 420 [micrograms per cubic meter] for 2 hours would inhale the same concentration as they would breathing 35 [micrograms per cubic meter] (the EPA’s 24-hour standard for PM2.5) for 24 hours in a city such as Los Angeles.”

(The studies actually exposed participants to PM levels of 600 micrograms per cubic meter, and one subject up to 751 micrograms per cubic meter — over 21 times the 24-hour standard!)

“The manager also stated that…the risk is small for those with no overt disease.”

Similarly, the agency failed to mention long-term cancer risks from diesel exhaust because “[a]n EPA manager considered these long-term risks minimal for short-term study exposures.”

And just two of the studies “alerted study subjects to the risk of death for older individuals with cardiovascular disease.”

The IG report provides a table detailing health impacts derived from EPA regulations and assessments from short-term exposure to particulate matter and diesel exhaust. For PM2.5, “mortality” is listed as a risk of short-term exposure.chart

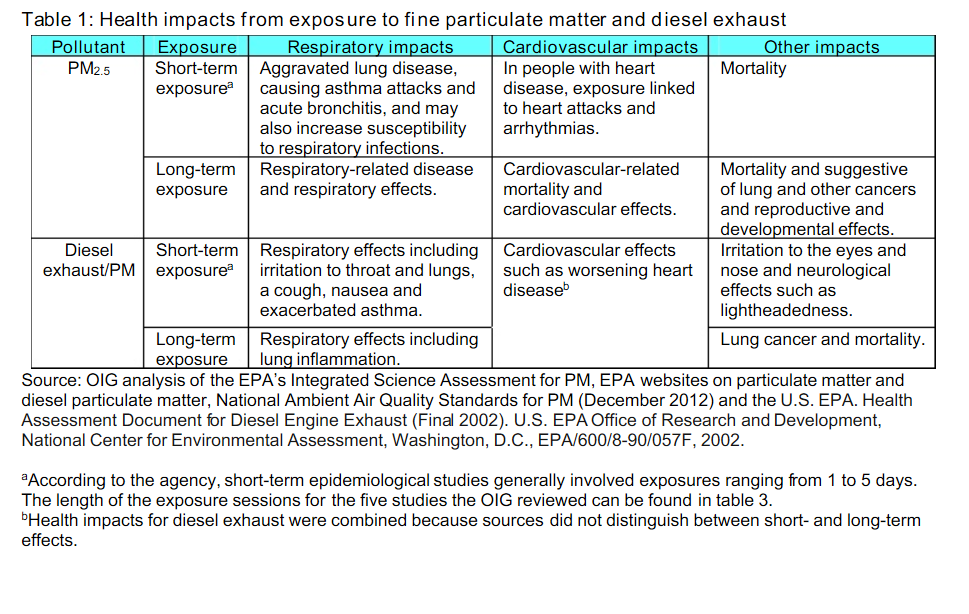
What else has the EPA told us about PM2.5?

  • “If we could reduce particulate matter to levels that are healthy, we would have an identical impact to finding a cure for cancer.” — EPA Administrator Lisa Jackson, testimony in front of the Subcommittee on Oversight and Investigations, House Committee on Energy and Commerce, September 22, 2011.
  • “Particulate matter causes premature deaths. It doesn’t make you sick. It is directly causal to dying sooner than you should.” — EPA Administrator Lisa Jackson, testimony in front of the Subcommittee on Oversight and Investigations, House Committee on Energy and Commerce, September 22, 2011.
  • “Overall, there is strong epidemiological evidence linking… short-term (hours, days) exposures to PM2.5 with cardiovascular and respiratory mortality and morbidity.” — EPA report on Air Quality Criteria for Particulate Matter, Volume II, October 2004.
  • “Short-term exposures to particles (hours or days) can aggravate lung disease, causing asthma attacks and acute bronchitis, and may also increase susceptibility to respiratory infections. In people with heart disease, short-term exposures have been linked to heart attacks and arrhythmias.” — EPA brochure on Particle Pollution and Your Health.
  • “The new studies support previous conclusions that short-term exposure to fine PM is associated with both mortality and morbidity.” — EPA report on Provisional Assessment of Recent Studies on Health Effects of Particulate Matter Exposure, July 2006.
  • “The best scientific evidence, confirmed by independent, Congressionally-mandated expert panels, is that there is no threshold level of fine particle pollution below which health risk reductions are not achieved by reduced exposure.” — Letter from Gina McCarthy, Asst. Administrator of the EPA, to Rep. Fred Upton, February 3, 2012.

In these reports and statements, exposure to PM 2.5 is dangerous (indeed, there is apparently no level of pollution at which health risks cease!). But the EPA’s human testing? Apparently not so dangerous.

The IG report summed up the agency’s missing warnings about the link between PM exposure and health effects this way: “This lack of warning about PM…is also different from its public message about PM.”

When an agency hails the reduction of particulate matter as the public health equivalent of curing cancer — and regulates on that basis — it loses credibility when it exposes humans to high levels of the pollutants and deems such exposure safe.

So, has the EPA exaggerated the effects of these particles in order to justify heavy-handed regulation? Or is the agency knowingly conducting dangerous experiments on human subjects?

Whichever it is, neither answer is comforting.

The Want to Regulate is Human, Let Prosper is Devine

The World Health Organization (WHO) recently released a study of the impact that air pollution has on human health around the world. It estimates that approximately 8.0 million people died in 2012 from air pollution related health issues: 3.7 million from outdoor air pollution exposure and 4.3 million from indoor air pollution exposure.

Critics have used this study to implore all nations to curtail air pollution levels. As usual, there is no consideration among the media responses that calls for using the economic approach to generate the greatest “bang for the buck.” Let me explain:

The WHO estimates that outdoor pollution caused 1.7 million deaths among the low-income nations of the Western Pacific, which amounts to 102 deaths per 100,000 people. It also estimates that outdoor pollution caused 0.9 million deaths in Southeast Asia, or 51 deaths per 100,000 people. The WHO states that these two regions alone accounted for 70% of all deaths attributable to outdoor air pollution.

Indeed, the WHO report states that, “88% of these deaths occur in low- and middle-income countries, which represent 82% of the world population.” It appears that people living in high income nations have largely avoided air pollution related deaths, either through lack of exposure or having better access to effective medical care.

Is the proper response to curtail economic prosperity and growth in the low to middle income countries in an attempt to decrease the levels of air pollution that economic activity creates, and thereby lower exposure levels? Or might the answer be to raise everyone’s living standards in these countries as much as possible, so that they, too, have the same options available that their more prosperous neighbors have? Perhaps these populations could afford lower-polluting but more costly production technologies, or could afford to provide better medical care options to those exposed. Which is best?

The WHO report indirectly yields evidence that would support the latter possibility, for it also reports on indoor pollution death rates. It estimates that in 2012, indoor pollution caused 1.7 million deaths in Southeast Asia, or 92 deaths per 100,000 people. Indoor pollution also caused 1.6 million deaths in the low-income Western Pacific nations, or 99 deaths per 100,000 people. These two regions alone accounted for over 75% of all deaths attributable to indoor air pollution. Adding the African nations raises the total to 90% of all deaths in 2012. Rich nation’s populations simply are not exposed to the indoor pollution from open-hearth cooking pits or dung-burning heat sources during cold weather.

Contrast these figures to only 1,300 deaths that the WHO states as arising in the high-income nations of the Americas, or only 0.3 deaths per 100,000 people. There were fewer than 100 deaths in high income European nations, or a number of deaths per 100,000 that was indistinguishable from zero. In fact, a recent WHO press release notes that, “deaths from household air pollution are over 5 times greater in low- and middle-income countries than wealthier ones.” I say let the nations prosper, and these death rates will fall.

EPA Raises a Stink over Sulfer Restrictions for the Oil Industry

The Wall Street Journal (WSJ) reports that the Environmental Protection Agency (EPA) has recently issued rules to cut the sulfur content of gasoline by 67% and to significantly reduce tailpipe emissions in cars and pickups, starting with the 2017 models. These new rules are known as “Tier 3 standards.” They are designed to reduce the smog created from tailpipe emissions and the subsequent incidence of various lung diseases.

Not surprisingly, both the WSJ and the New York Times (NYT) reports that federal adoption of these stricter Tier 3 standards found broad based support among many environmental and health groups. The Natural Resources Defense Council said the Tier 3 standards could save America $19 billion a year in health-related costs by 2030. The American Lung Association said that Tier 3 standards will reduce pollution equivalent to taking 33 million cars off the road.

Smart Growth and Livability: The Road to More Intense Air Pollution and Traffic Congestion

Population Density and Air Pollution: For years, regional transportation plans, public officials, and urban planners have been seeking to densify urban areas, using strategies referred to as “smart growth” or “livability.” They have claimed that densifying urban areas would lead to lower levels of air pollution, principally because it is believed to reduce travel by car. In fact, however, EPA data show that higher population densities are strongly associated with higher levels of automobile travel and more concentrated air pollution emissions.

This is illustrated by county-level data for nitrogen oxides (NOx) emissions, which is an important contributor to ozone formation. This analysis includes the more than 425 counties in the nation’s major metropolitan areas (those with more than 1 million in population).

Seven of the 10 counties with the highest NOx emissions concentration (annual tons per square mile) in major metropolitan areas are also among the top 10 in population density (2008). New York County (Manhattan) has by far the most intense NOx emissions and is also by far the most dense. Manhattan also has the highest concentration of emissions for the other criteria air pollutants, such as carbon monoxide, particulates, and volatile organic compounds (2002 data). New York City’s other three most urban counties (Bronx, Kings, and Queens) are more dense than any county in the nation outside Manhattan, and all are among the top 10 in NOx emission density.

Traffic and Air Pollution: More concentrated traffic also leads to greater traffic congestion and more intense air pollution. The data for traffic concentration is similar to population density.[7] Manhattan has by far the greatest miles of road travel per square mile of any county. Again, seven of the 10 counties with the greatest density of traffic are also among the 10 with the highest population densities. As in the case of NOx emissions, the other three highly urbanized New York City counties are also among the top 10 in the density of motor vehicle travel.

There is a significant increase in the concentration of both NOx emissions and motor vehicle travel in each higher category of population density. For example, the counties with more than 20,000 people per square mile have NOx emission concentrations 14 times those of the average county in these metropolitan areas, and motor vehicle travel is 22 times the average. All of this is consistent with research by the Sierra Club and a model derived from that research by ICLEI–Local Governments for Sustainability, both strong supporters of densification, show that traffic volumes increase with density.

Public Health: These data strongly indicate that the densification strategies associated with smart growth and livability are likely to worsen the concentration of both NOx emissions and motor vehicle travel. But there is a more important impact. A principal reason for regulating air pollution from highway vehicles is to minimize public health risks. Any public policy that tends to increase air pollution intensities will work against the very purpose of air pollution regulation—better public health. The American Heart Association found that air pollution levels vary significantly in urban areas and that people who live close to highly congested roadways are exposed to greater health risks. The EPA also notes that NOx emissions are higher near busy roadways. The bottom line is that—all things being equal—higher population density, more intense traffic congestion, and higher concentrations of air pollution go together.

All of this could have serious consequences as the EPA expands the strength of its misguided regulations. For example, officials in the Tampa–St. Petersburg area have expressed concern that the metropolitan area will not meet the new standards, and they have proposed densification as a solution, consistent with the misleading conventional wisdom. The reality is that this is likely to make things worse, not better. Officials there and elsewhere need to be aware of how densification worsens air pollution intensity and health risks and actually defeats efforts to meet federal standards.

Growth That Makes Areas Less Livable:
There are myriad difficulties with smart growth and livability policies, including their association with higher housing prices, a higher cost of living, muted economic growth, and decreased mobility and access to jobs in metropolitan areas. As the EPA data show, the densification policies of smart growth and livability also make air pollution worse for people at risk, while increasing traffic congestion.

Additional details will be found at Wendell Cox, ” Population Density, Traffic Density and Nitrogen Oxides (NOx) Emission Air Pollution Density in Major Metropolitan Areas of the United States,” http://www.demographia.com/db-countynox.pdf.

This article is adapted from a Heritage Foundation web memo (http://www.heritage.org/research/reports/2011/09/how-smart-growth-and-livability-intensify-air-pollution)