Category: Global Warming

Lies, Damn Lies and Statistics: The 2014 National Climate Assessment Report

The 2014 U.S. National Climate Assessment (NCA) report has been receiving much attention since President Obama heralded it in his speech back in May. The administration realizes that the push for ever greater climate change regulations requires convincing evidence of sufficient alarm to justify this authoritarian push. While this report delivers the alarm, it falls short on verifiable evidence. Indeed, a scientific rebuttal of many parts of the NCA report appears here.

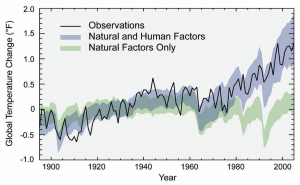
However, an astute follower of our NCPA Energy and Environment blog, Tom Isaacson, has also reviewed the NCA report and has found it wanting. He points out that the evidence used in the report to verify the impact of mankind’s activity on global temperatures is badly misrepresented. And he uses the information cited in the NCA report as proof to back his claim. Page 8 of the NCA report contains this graphic:

global temp change

Isaacson points out that this graphic portrays two confidence bands produced by the accepted climate models to predict annual average global temperature changes over the years. The lower band (in green) represents the range of temperature changes that the models predict would have occurred naturally without any human factors. The upper band (in blue) represents the range of predicted temperature changes when both natural and human factors are combined. The solid black line indicates the actual observed temperature changes for each year, ending in 2005.

The NCA report notes that the annual temperature changes over the past half century have been almost entirely within the band of predicted changes arising from both human and natural impacts, but almost entirely outside the band of predicted changes arising from only natural impacts. This implies that not only are the accepted climate models accurate and trustworthy, but they also provide evidence supporting the conclusion that the actions of mankind are indeed responsible for global warming.

However, this is where Isaacson points out the “sleight of hand” used in the statistical analysis: the NCA analysis and graphic both use the wrong prediction bands to build credibility for the models and to support their conclusions. His proof: the NCA report bases their analysis and above graphic on an 2011 article written by Markus Huber and Reto Knutti (H&K) in the journal, Nature Geoscience. Their graphic appears below:

global temp change2

The lower prediction band (in blue) represents the predicted range of temperature changes that would have occurred naturally without any human factors. The middle band (in orange) represents the range of changes if only human factors are reflected. The upper band (in grey) represents the range of changes if both human and natural factors are combined. Now let us have a look up the sleeve of the NCA magicians…

Note how the grey prediction band from H&K graphic representing both human and natural factor impacts is narrower than the orange band representing only human factor impacts, which in turn is slightly narrower than the band representing natural factors alone. These relative band size relationships are clearly notretained in the NCA report graphic, which shows the prediction band for the combined human and natural factors as being much wider than for the natural factors alone.

In other words, it appears that the authors of the NCA report use an incorrect, wider confidence band to make the temperature predictions of the climate models to appear artificially accurate, thereby making the climate models appear to be more trustworthy. To illustrate, note that the spike in average global temperature change in 1998, and the dip in 2000, both fell completely outside the grey prediction band in the H&K chart, but fall completely inside the blue prediction band in the NCA report.

Further, Isaacson notes that the NCA report cuts off their chart in 2005, while the H&K chart continues on out to 2010. Indeed, the attenuated NCA chart fails to show that the low temperatures recorded in the H&K chart for 2007, 2008 and 2009 all lie below and outside the grey prediction band. This means that the model creates a prediction band that fails to include 5 of the last 12 years of the observed annual data — because the temperatures were lower than predicted.

I am sorry, but Tom and I both feel that being wrong 41 percent of the time over the last twelve years is certainly not a good enough track record to justify using these findings to impose many billions of dollars’ worth of climate change regulations onto a sputtering American economy.
Adaptation Strategies for Climate Change

Although negligibly, climate change is happening, and addressing the issue in the short-term may prevent drastic future effects. When determining how to actually address climate change, two main strategies exist: mitigation and adaptation. While these two may appear similar, a nuanced difference distinguishes the two. Mitigation addresses the causes of climate change, while adaptation addresses the effects of climate change. Even though adaptation is a form of mitigation, it attempts to mitigate the harmful effects, not the causes. According to the Environmental Protection Agency (EPA), adaptation strategies can be either protective (guarding against the negative impacts of climate change) or opportunistic (taking advantage of any beneficial effects of climate change).

While an exact range is not agreed upon, most studies predict that the global mean in temperature has and will continue to rise. Some predict marginal gains, while others predict a drastic spike. Nevertheless, most agree that climate change is happening, and the evidence clearly reveals a trend in increasing temperatures. However, even though a consensus exists with regards to the veracity of climate change, no consensus exists on its causes. If the exact causes are unknown, nations spending money on mitigation strategies are taking shots in the dark at trying to stop climate change. Thus, nations may find adaptation measures more economically sensible than mitigation, as these strategies are a guaranteed way of protecting society.

As adaptation clearly appears the appropriate method of addressing climate change, many different strategies have been proposed to protect various sectors and industries. However, while the strategies may differ, the process of planning effective adaptation strategies tends to follow a similar, cyclical pattern for most nations. Here are the most common and effective six steps, according to the National Research Council:

  1. Identify current and future climate changes relevant to the system.
  2. Assess the vulnerabilities and risks to the system.
  3. Develop an adaptation strategy using risk-based prioritization schemes.
  4. Identify opportunities for co-benefits and synergies across sectors.
  5. Implement adaptation options.
  6. Monitor and reevaluate implemented adaptation options.

With this established methodology for discovering and implementing adaptation strategies, the EPA has given various examples of policies for each sector.

SECTOR ADAPTATION STRATEGY
Agriculture and Food Supply
  • Breed crop varieties that are more tolerant of heat, drought, and water logging from heavy rainfall or flooding
  • Protect livestock from higher summer temperatures by providing more shade and improving air flow in barns
Coasts
  • Promote shore protection techniques and open space preserves that allow beaches and coastal wetlands to gradually move inland as sea levels may rise.
  • Identify and improve evacuation routes and evacuation plans for low-lying areas, to prepare for increased storm surge and flooding.
Ecosystems
  • Protect and increase migration corridors to allow species to migrate as the climate changes.
  • Promote land and wildlife management practices that enhance ecosystem resilience.
Energy
  • Increase energy efficiency to help offset increases in energy consumption.
  • Harden energy production facilities to withstand increased flood, wind, lightning, and other storm-related stresses.
Forests
  • Removing invasive species.
  • Promoting biodiversity and landscape diversity.
  • Collaborating across borders to create habitat linkages.
  • Managing wildfire risk through controlled burns and thinning.
Human Health
  • Implement early warning systems and emergency response plans to prepare for changes in the frequency, duration, and intensity of extreme weather events.
  • Plant trees and expand green spaces in urban settings to moderate heat increases.
Society
  • Developing plans to help elderly populations deal with more extreme weather.
  • Relocating communities where in-place adaptation is not feasible.
  • Considering how the private sector can support and promote adaptation.
  • Understanding the specific needs of sensitive populations.
Transportation
  • Raising the level of critical infrastructure.
  • Changing construction and design standards of transportation infrastructure, such as bridges, levees, roads, railways, and airports.
  • Abandoning or rebuilding important infrastructure in less vulnerable areas.
Water Resources
  • Improve water use efficiency and build additional water storage capacity.
  • Protect and restore stream and river banks to ensure good water quality and safe guard water quantity

Often times, an effective strategy takes the dual-mandate approach, implementing adaptation and mitigation processes. However, with mitigation looking less effective each day, going all in on necessary adaptation strategies seems to be more appropriate. While mitigation strategies may buy a little more time in the long-run, adaptation strategies must take precedence as they will have definitive positive impacts. Rather than implementing new regulations to curb carbon emissions or regulate business, the federal government should work to prioritize the protection of these industries.

Tanner Davis is a research associate at the National Center for Policy Analysis.

EPA Attacks Coal

Part of President Obama’s plan to fight climate change includes closing down 140 existing coal fueled power plants. The plan calls for a shift from carbon emitting sources of energy to more efficient renewable source that will do less to affect the climate.

Impact of government action:

  • 140 coal plants closed
  • Those plants account for only 4 percent of all CO2 emitted last year by U.S. coal plants
  • Coal facilities will provide 30 percent of the nations’ electricity
  • Down from 52 percent in 2000
  • 35,000 to 38,000 coal industry jobs lost

According to USA TODAY:

The electric power industry’s plan to retire more than 10 percent of its coal-fired generators within a decade will do almost nothing to reduce emissions of heat-trapping carbon dioxide.

Comparing Protocols: Successes, Failures, and Recommendations

A recent New York Times article — “Trying to Reclaim Leadership on Climate Change” — reports the longstanding indifference toward climate change. In fact, President Obama’s proposal of new rules to cut emissions at power plants makes him one of the few political leaders with a serious agenda on the issue. However, even Mr. Obama’s noble attempt will remain futile if the rest of the world is unwilling to follow suit. With the ineffectiveness at recent protocols, it is worth comparing two protocols to determine how to address the issue going forward and why Mr. Obama is trying to reclaim leadership on the issue.

Montreal Protocol

  • When: September 16, 1987
  • Where: Montreal, Canada
  • Issue: Depletion of the ozone layer and Chlorofluorocarbons (CFCs)
  • Successful?: Yes

With the discovery that certain substances, notably CFCs, were rapidly depleting the ozone layer, many nations sought to solve the issue but recognized that this issue transcended every individual border. Since the ozone layer belongs to all nations not simply one, it was the responsibility of all nations to address the pressing issue. Thus, as a multilateral force, they concocted a plan to slow the depletion of the ozone layer so it could recover. As stated, the protocol would phase-out CFCs from commercial production, particularly in the aerosol industry. And it has worked!

Considered a major multilateral success, the Montreal Protocol is persistently touted as the prime example of how well nations can work together on global environmental issues. But why was it successful? The Montreal Protocol had the perfect combination of factors: hegemons (U.S. and U.K.) taking the lead, a short timeframe before the ozone was projected to dissolve, a great mutuality of interests among the attending parties, and concentrated benefits with distributed costs.  Due to all of these factors, 197 parties have already ratified the protocol, making it the poster child for a successful multilateral operation on environmental regulation.

Kyoto Protocol

  • When: December 11, 1997
  • Where: Kyoto, Japan
  • Issue: Anthropogenic greenhouse gas (GHG) emissions
  • Successful?: No

Attempting to ride the success of Montreal, nations reconvened to address another environmental matter: anthropogenic GHG emissions causing climate change. However, this time the result was not so successful, for a few reasons. First of all, the major hegemons were hesitant to take the lead, as limiting carbon emissions could severely harm industries and make energy prices very expensive. Second, since there was no general consensus as to when climate change would occur, who or what caused it, and how drastic the effects were going to be, many parties shied from ratifying a protocol that could potentially not offer any ecological benefit. Third, a carbon cap would hinder developing economies that were just now going through their own industrial revolutions more so than nations with already developed economies, resulting in a discordance of interests. Finally, because every nation would be sacrificing economic growth for uncertain environmental security, each nation would bear concentrated costs with diffused benefits. Nevertheless, 55 nations ratified the protocol, committing to reduce carbon emissions 5 percent by 2010 and 10 percent by 2020. However, CBC news confirmed the failure of Kyoto, citing a 58 percent increase in emissions within the past decade.

U.S. Policy Going Forward

Clearly, Montreal was much more successful than Kyoto for a variety of reasons. With the success in Montreal and other protocols attempting to address the issues raised by Kyoto, Obama proposed domestic rules to limit carbon emission in the United States. Whether or not his policy will curb climate change is up for debate. However, Obama recognizes that if another multilateral environmental success is to occur in the future, the United States must take the lead to ensure that others. Additionally, the U.S. must offer incentives for other nations to also commit to the same goals. Without the support of other nations, Obama’s proposal will result in substantial economic costs with minimal ecological benefits.

Tanner Davis is a research associate at the National Center for Policy Analysis.

Economic Consequences of Climate Change Policies

According to The Growing Benefits of a Warmer World by the NCPA, global warming has many tangible benefits to the economy. Supplementing the argument, many negative economic consequences exist from climate change policy. Thus, a two-fold offensive argument exists: global warming helps the economy and policies to curb warming hurt the economy.

A study conducted by the Heritage Foundation found that carbon policies with very lofty targets and goals, such as the Waxman-Markey legislation (an 80 percent cut in CO2 emissions by 2050) passed by the House of Representatives in 2009, would have long-term detrimental economic effects:

  • An aggregate income loss to the U.S. of $207.8 trillion by 2100.
  • An aggregate income loss worldwide of $109.6 trillion by 2100.
  • A one-year worldwide loss of $3.5 trillion in 2100, equivalent to 4.75 percent of U.S. Gross Domestic Product.
  • Adverse impacts, on net, in every year of implementation.

Even more startling, these numbers assume that the U.S. is the only country to enact a carbon policy. The numbers skyrocket when including the rest of the world implementing similar policies. As such, while these policies may address environmental degradation, the negative economic effects greatly outweigh the positive results in all aspects of the “cost-benefit analysis.” In fact, having a stronger economy will help society to overcome the negative effects of climate change. Stronger economies have much easier accessibility to and flexibility with adaptation strategies.

Additionally, taken from a report by the Council on Foreign Relations,

Lawmakers and industry leaders worry that such greenhouse-gas caps in the United States will reduce the ability of U.S. companies to compete with foreign imports, leading U.S. companies to move to countries without greenhouse-gas restrictions, which is often termed ‘leakage’.

This same report offers many solutions to these qualms, but concludes that attempts to offset economic harm would pose a number of hurdles. While the end of this report also suggests economic benefits for these policies, the increased cost of domestic energy offsets any potential benefits.

Thus, instead of having the federal government apply more regulations and issue further policies to curb carbon emissions, the United States should encourage more private sector development to adapt to and mitigate the effects of impending climate change.

The U.S. should actually follow the example set forth by the United Nations via its Private Sector Initiative. By allowing for a unified database of case studies, companies all over the world can view actions implemented by other companies to reduce risks to their business operations. Many of these case studies also offer strategies for investing in adaptation action in vulnerable regions in a sustainable and profitable manner. This model for preventative and adaptive action is exactly what the U.S. should follow, as it filters and disperses innovative ideas throughout the private sector at a time when the federal government remains inefficient in addressing these issues.

Tanner Davis is a research associate at the National Center for Policy Analysis.

Smart Growth: Destroying Housing Opportunity from California to Australia (and Beyond)

Two recent stories provide further  evidence on the extent to which urban containment policies (also called smart growth, growth management, compact city policy, livability and urban consolidation) raises house prices relative to incomes, thereby reducing housing affordability. Because housing represents the largest element of household budgets (not transportation as a US government website implies), urban containment policy reduces discretionary income — the money households have left over after taxes and paying for necessities. This leads to a lower standard of living and more poverty, and violates the fundamental purposes of urban planning, described by former World Bank principal planner Alain Bertaud as:

“Increasing mobility and affordability are the two main objectives of urban planning. These two objectives are directly related to the overall goal of maximizing the size of a city’s labor market, and therefore, its economic prosperity.”

Two recent stories describe the effects of urban containment policy on the standard of living:

The Economist and Urban Containment “Fat Cats”

“Free Exchange” in The Economist came  down strongly on the side of economics in a review of housing affordability.

According to The Economist, the unusually high cost of housing in San Francisco (and other places) is principally the result of tight land use regulation, which makes it expensive or impossible to build. If “local regulations did not do much to discourage creation of new housing supply, then the market for San Francisco would be pretty competitive.” Add to that Vancouver, Sydney, Melbourne, Toronto, Portland and a host of additional metropolitan areas, where urban containment policy has driven house prices well above the 3.0 median multiple indicated by historic market fundamentals.

The Economist explains the issue in greater detail: “We therefore get highly restrictive building regulations. Tight supply limits mean that the gap between the marginal cost of a unit of San Francisco and the value to the marginal resident of San Francisco (and the market price of the unit) is enormous. That difference is pocketed by the rent-seeking NIMBYs of San Francisco. However altruistic they perceive their mission to be, the result is similar to what you’d get if fat cat industrialists lobbied the government to drive their competition out of business.” (Our emphasis).

Of course urban planning interests have long denied that that rationing land is associated with higher housing prices (read greater poverty and a lower standard of living). Nonetheless urban containment policies not only drive up the price of land, but do so even as they reduce the amount of land used for each new residence, driving prices per square foot of land up as well.

The Economist notes that unless the direction is changed, housing policy will continue to be “an instrument of oligarchy. Who knows. But however one imagines this playing out, we should be clear about what is happening, and what its effects have been.”

Land Prices Skyrocket as Residential Lot Sizes Fall in Australia

The extent to which smart growth policy (urban continament policy or urban consolidation policy) is associated with higher land (and house) prices is illustrated by a recent press release from RP Data in Australia. The analysis examined the vacant building lot prices for the period of 1993 to 2013.

During the period, the median price of a vacant lot rose 168 percent after adjustment for inflation.This is nearly 5 times the increase in the median household incomes of the seven largest capital cities (Sydney, Melbourne, Brisbane, Perth, Adelaide, Canberra and Sydney).

But it gets worse. The median lot size was reduced nearly 30 percent. This should put paid to the myth that urban containment reduces lot prices as it reduces their sizes. The same dynamic has been indicated in the United States.

Australia has been plagued by huge house cost increases relative to incomes in association with urban containment policy. Before the adoption of urban containment policy, it was typical for house prices to average three times or less than that of household income. Now, Sydney has the highest median multiple (median house price divided by median household income) of any major metropolitan area in the New World, with the exceptions of Vancouver and San Francisco. Melbourne, the second largest metropolitan area in Australia, has a median multiple of 8.4, making it fifth most costly in the New World, behind San Jose. All of Australia’s major metropolitan areas are “severely unaffordable,” including slow-growing Adelaide (6.3), as well as most smaller areas.

Getting Priorities Right

Research on these impacts led London School of Economics professor Paul Cheshire to conclude that urban containment policy is irreconcilable with housing affordability. This means that urban containment policy is irreconcilable with a better economic future for households, including those in poverty.

The purposes of urban containment policy are largely driven by a particular vision of the urban form and a manifestly wrongheaded belief that rationing land and limiting mobility can contribute materially to reducing greenhouse gas emissions. The issue is neither urban design nor the expensive and ineffective strategies of urban containment. People are more important — their standard of living and reducing the number living in poverty. There is a compelling need to reorient urban policy in this direction (see Toward More Prosperous Cities).

—–

For a complete listing of median multiples by major metropolitan area, see the 10th Annual Demographia International Housing Affordability Survey.

Additional information on the RP Data research is available at Australian Property Through Foreign Eyes

—–

Note: This article is adapted from contributions by the author to the newgeography.com

Emiminate Insurers of Last Resort

The reaction to Superstorm Sandy’s $65 billion in damage has been the predictable doom and gloom about climate change and rising sea levels. But instead of implementing draconian restrictions, we can prevent loss of life and property by eliminating insurance of last resort.

Extreme weather is nothing new. Paris was flooded on a regular basis by the Seine River until Napoleon III built walls for flood prevention. But while it was logical for earlier generations to live on higher ground away from major bodies of water, it now seems logical to us to build as close to the ocean as possible. Boston, New York City and much of the population in the state of Florida is flood prone. Between 1970 and 2000, East Coast areas grew in population. When four hurricanes hit Florida in 2004 and Superstorm Sandy hit the northeast in 2012, many people incurred major property losses.

Insurance companies made poor decisions to cover some of these properties. But most companies have adjusted their portfolio. Yet instead of letting the market work and forcing folks who rebuild homes on barrier islands to go without coverage, many states stepped into the game by providing insurance of last resort. Premiums for these policies are offered below market rate with taxpayers subsidizing the difference. For example in Miami-Dade County, FL the insurance premium on a $150,000 house with Citizens (the Florida insurer of last resort) costs $4,600. With a traditional insurance company the premium is $10,000. Worse, some states actually encouraged the private sector to dump questionable policies into the last resort pool.

If private insurers cannot provide insurance to certain coastal location, this is a signal that building a home in this location is a poor decision. And if one of these homes is going to get damaged by the next storm, it is not a good policy decision to encourage folks to live there. If the private sector cannot provide insurance to folks building new homes, the government should not provide it either. Current homeowners can be transferred over time to the private market, assuming they do not get hit by multiple storms. Potential owners can still build in hurricane prone areas, but taxpayers should not bail them out when the inevitable next storm strikes.

New IPCC Report: Death and Destruction!

The IPCC’s latest report (Climate Change 2014: Impacts, Adaptation, and Vulnerability) and it’s full of observations and predictions of calamity is now available.

Just a scan of the news headlines reveals the catastrophe once again forecast by the IPCC: Climate change to leave no one on planet ‘untouched,’ IPCC chief, New Climate Change Report Warns of Dire Consequences, New U.N. Report: Climate Change Risks Destabilizing Human Society, Climate change a threat to security, food and humankind – IPCC report, Panel’s Warning on Climate Risk: Worst Is Yet to Come.

Ahh!

The IPCC may be full of gloom and doom, but not everyone is on board. Joseph Bast over at Forbes looked at the 8 main risks in the report that the IPCC listed as “reasons for concern.” He puts them alongside conclusions from the Nongovernmental International Panel on Climate Change (NIPCC). Founded by atmospheric physicist Fred Singer, the NIPCC’s scientists assess global warming science and conduct independent reviews of the IPCC reports.

Just a few examples of the differences between the IPCC and NIPCC reports:

  • Food insecurity? Yes, says the IPCC. Little or no risk, says the NIPCC.
  • Severe harm for urban populations due to flooding? Yes, says the IPCC. No, says the NIPCC.
  • Systemic risks due to extreme weather events? Yes, says the IPCC. There is no support that precipitation in a warmer world becomes more variable and intense, says the NIPCC.
  • Risk of mortality, morbidity, and other harms? Yes, says the IPCC. No, says the NIPCC: Modest warming will actually result in a net reduction of human mortality.

The NIPCC reports are peer-reviewed, produced by scientists from 20 countries around the world, and cite thousands of peer-reviewed studies. The latest report is over 1,000 pages, and anyone can go online and view them.

Bast asks,

So is man-made global warming a crisis? Don’t just wonder about it, understand it yourself. Read one or a few chapters of one of the NIPCC reports, and ask if what you read is logical, factual, and relevant to the debate. See if the UN or its many apologists take into account the science and evidence NIPCC summarizes, and then decides whether its predictions ‘of death, injury, and disrupted livelihoods’ is science or fiction.

Matt Ridley over at the Wall Street Journal notes that the IPCC report predicts 70 percent more warming by the end of this century than the best science actually suggests. He then asks — what distinguishes the global warming “crisis” from the other crises we’ve been warned about in the past?

There remains a risk that the latest science is wrong and rapid warming will occur with disastrous consequences. And if renewable energy had proved by now to be cheap, clean and thrifty in its use of land, then we would be right to address that small risk of a large catastrophe by rushing to replace fossil fuels with first-generation wind, solar and bioenergy. But since these forms of energy have proved expensive, environmentally damaging and land-hungry, it appears that in our efforts to combat warming we may have been taking the economic equivalent of chemotherapy for a cold.

Almost every global environmental scare of the past half century proved exaggerated including the population “bomb,” pesticides, acid rain, the ozone hole, falling sperm counts, genetically engineered crops and killer bees. In every case, institutional scientists gained a lot of funding from the scare and then quietly converged on the view that the problem was much more moderate than the extreme voices had argued. Global warming is no different.

Are we really willing to transform our economies based on reports derived from faulty, ill-constructed models? Unless more people delve into these IPCC reports and look at the evidence presented by the NIPCC and others, we’re likely to do just that.

The Growing Benefits of a Warmer World

Global warming has stalled for the last 16 years, but the warming that has occurred over the last 150 years — despite what is commonly believed — has actually been beneficial. In fact, the earth should continue to see benefits from warming for the foreseeable future, says H. Sterling Burnett, a former senior fellow with the National Center for Policy Analysis.

A study by economist Richard Tol found that until 2080, and potentially beyond that, a warming trend would have a positive impact on the world’s economy. Over the last 150 years, the globe has warmed an average 0.8 degrees Celsius. An additional 2.2 degree rise in temperature would continue to yield substantial benefits.

Climate change over the last century has added 1.4 percent to global economic output, Tol found. By 2025, that figure should reach 1.5 percent of gross domestic product (GDP).

Increases in carbon dioxide (CO2) have added 0.8 percent to GDP because of the boost to agriculture. Similarly, the temperature increase has reduced the demand for heating, adding 0.4 percent to GDP.

With higher CO2 levels, plants thrive and become more efficient in their use of water. And because most of the warming has reduced low nighttime temperatures, the globe has seen fewer growth-stunting frost events, as well as longer growing seasons.

  • Agronomist Craig Idso determined that a 300 parts per million rise in CO2 increases plant biomass 25 percent to 55 percent.
  • From 1961 to 2011, the annual value of improved plant growth grew from $18.5 billion to more than $140 billion, amounting to a total of $3.2 trillion.
  • From today to 2050, Idso determined that increases in CO2 will result in $9.8 trillion in additional crop production.
  • Notably, it is Africa that is benefiting largely from improved agricultural production.

Growing faster than all other continents, one-third of African countries are growing at 6 percent per year. And from 2005 to today, the amount of people living below the poverty line has fallen from 51 percent to 39 percent.

African farmers are replacing crops introduced by colonial governments with traditional crops that grow best in warm, dry conditions. In sub-Saharan Africa, the growth of agricultural GDP increased from 2.3 percent per year in the 1980s to 3.8 percent each year from 2000 to 2005.

Food production is actually outpacing population growth in Uganda and the 15 countries of West Africa.The poverty rate in Ghana has fallen in half, while farm output has increased 5 percent every year for the last two decades. Even Ethiopia and Malawi are growing record amounts of crops and exporting surpluses.

Source: H. Sterling Burnett, “The Growing Benefits of a Warmer World,” National Center for Policy Analysis, March 18, 2014.

Climate Change Talkathon

While you were snoozing last week, a group of Democratic senators were at work on the Senate floor. Senator Brian Schatz said:

We have a simple message for all Americans: We’re not going to rest until Congress acts on the most pressing issue of our time.

A lack of jobs? Americans losing their health insurance? The deficit? Which of these issues did Schatz and his 30 cohorts stay up all night to debate and demand action on?

Climate change. That is right, with Americans dropping out of the workforce in record numbers and cancer patients unable to see their doctors, our leaders are taking turns talking on the floor about global warming. And according to a spokesman from Sen. Sheldon Whitehouse’s office, this is not the last time that we will hear from the Senate Climate Action Task Force.

This is just a desperate attempt to appeal to their donor base and bring a non-issue to the forefront to distract from Obamacare, a weak president, and an ailing economy. The war on women was last election season’s non-sequitur (and no doubt it will be in full-swing again come this November), and we’ve already heard from the President and other members of Congress this year that we need to make addressing climate change a major priority.

But while the Democrats may want to hang their 2014 hat on global warming, climate change is, to voters, a relative non-issue. See this Pew poll from January: of a whopping 20 issues tested as policy priorities, the American public put global warming in 19th place, above only global trade issues. This is not some sort of statistical abnormality — global warming is routinely found at the bottom of the list.

Fun fact: Anthony Watts pointed out that the Senators conducted their talkathon from the warm and cozy Senate floor, courtesy of the Capitol’s coal-fired power plant.