Natural Gas Production by State
From the American Legislative Exchange Council (ALEC):
One of the greatest achievements of the American 21st Century has been the advances made in hydraulic fracturing and horizontal drilling technologies. These innovative well stimulation and extraction techniques have made enormous quantities of hydrocarbons that have been locked away in shale rock accessible now for the first time.
Between 2000 and today, domestic natural gas withdrawals have increased by roughly 25 percent, leading to an abundant supply of inexpensive fuel that can be used to generate electricity and provide space heat. A decade ago, policymakers were discussing the need to import liquefied natural gas (LNG) in order to meet American energy demands. Today, LNG export terminals are under construction in Maryland, Louisiana and Texas.
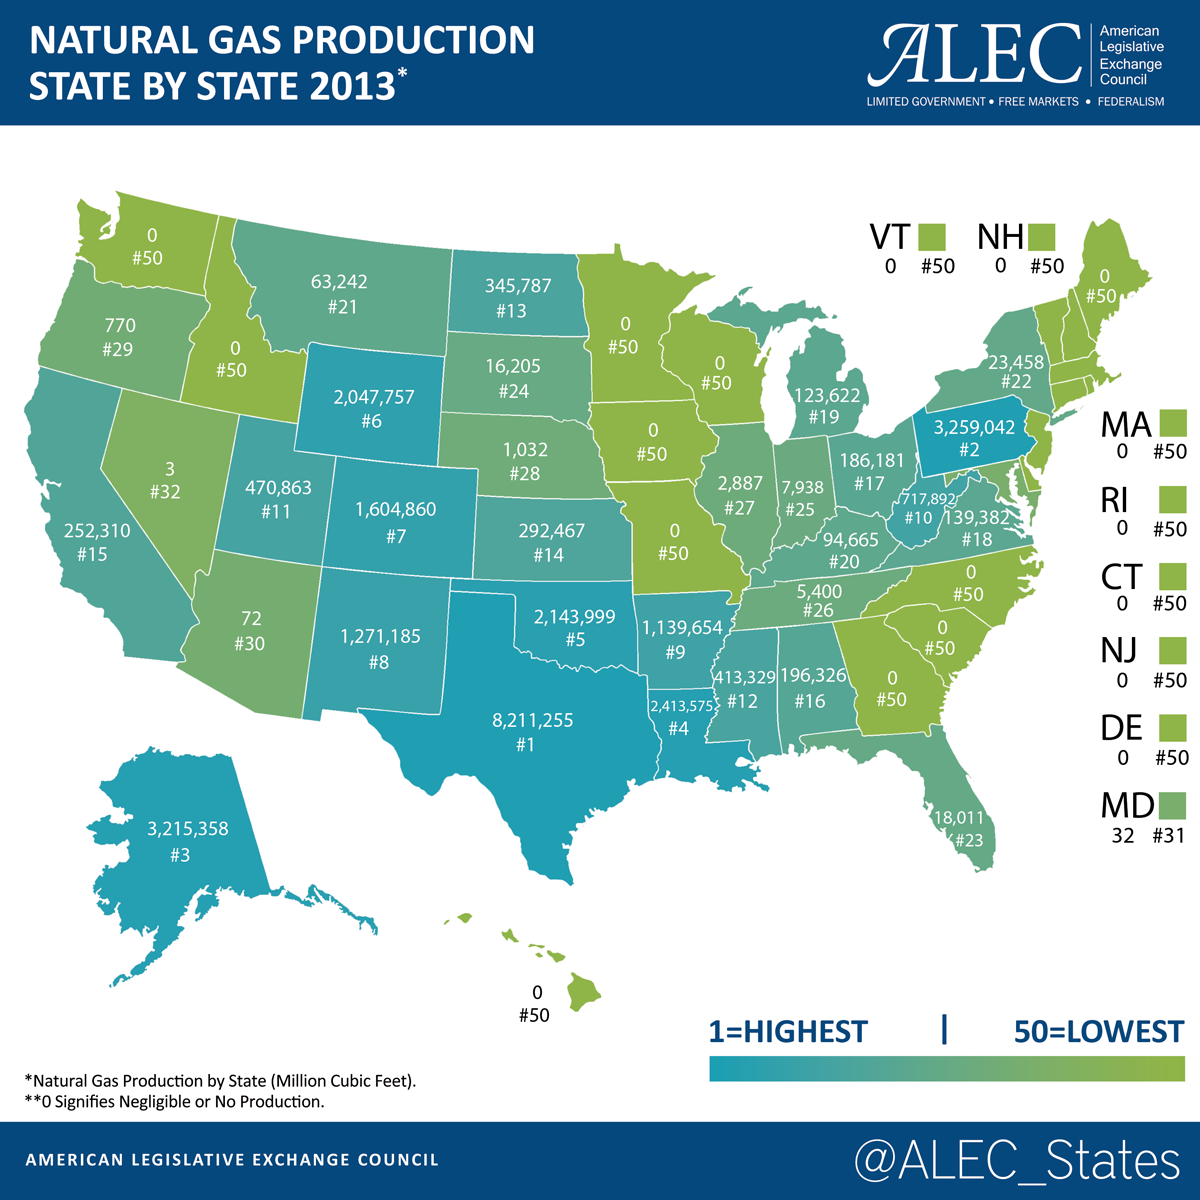
The map above shows total natural gas production by state in 2013, the most recent year for which data is available. Unsurprisingly, the difference between Pennsylvania and New York — both of which lie on top of the gas-rich Marcellus shale play — is stark. Pennsylvania, having embraced hydraulic fracturing currently produces roughly 140 times more natural gas compared to New York, which has implemented a statewide ban on the well stimulation technique.
Fascinating map. Thanks, Lloyd.